
Every generation of Indian investors eventually runs into 2008 in conversation, usually as a cautionary shorthand rather than a specific set of facts: “remember what happened in 2008.” What actually happened, in specific numbers, is worth revisiting directly, because the lessons that hold up aren’t really about predicting the next crisis — nobody reliably does that — they’re about what the arithmetic of 2008 reveals about diversification, leverage, liquidity, and behaviour under genuine stress, lessons that remain just as relevant in calm markets as in turbulent ones.
Table of Contents
| QUICK DEFINITION The 2008 global financial crisis was a systemic banking and credit crisis, triggered in the United States and transmitted worldwide, that produced a sharp decline across most major equity markets, including India’s, roughly between January and October 2008, followed by a multi-year recovery. This article uses the specific, sourced figures of that decline and recovery as a lens for durable trading and investing lessons, not as a prediction that history will repeat in the same shape. All historical figures are drawn from secondary financial-education sources and flagged for verification against primary data before publication; illustrative material is clearly labelled as such. |
What made 2008 a systemic crisis, not a sector-specific one
Most market declines are sector- or event-specific: a regulatory change hits one industry, a commodity price swing hits commodity-linked stocks, an earnings miss hits one company and its close peers. The 2008 crisis was structurally different — it originated in the global banking and credit system itself, the plumbing nearly every other sector depends on to function.
Because the crisis struck the credit system directly, its effects transmitted broadly rather than staying contained: banks became reluctant to lend to each other, let alone to businesses, and that credit freeze rippled into nearly every sector that depends on financing to operate, expand, or simply manage working capital.
For Indian markets specifically, the transmission arrived less through direct exposure to the failed US institutions and more through the broader mechanisms of global risk aversion: foreign institutional investors pulled capital from emerging markets broadly, including India, to shore up balance sheets elsewhere, and global trade and credit conditions tightened in ways that touched the Indian economy directly.
This systemic quality — a crisis in the financial system’s core infrastructure rather than in one sector sitting on top of it — is precisely why 2008 is treated differently from an ordinary bear market in most retrospective analysis, and why its lessons generalise more broadly than lessons from a typical sector-specific downturn.
It’s worth being precise that this article focuses specifically on what 2008 demonstrated about markets and investor behaviour — it is a historical case study, not a forecast, and nothing in this article should be read as predicting the timing, cause, or severity of any future crisis.
That said, systemic doesn’t mean uniform — even during 2008, certain sectors and business models absorbed noticeably more direct stress than others, particularly companies and institutions with the heaviest reliance on short-term wholesale funding or the most direct linkages to the failing global credit chain, while sectors with steadier domestic demand and lower leverage generally fared relatively better, though still far from unaffected.
The timeline of the key global trigger events
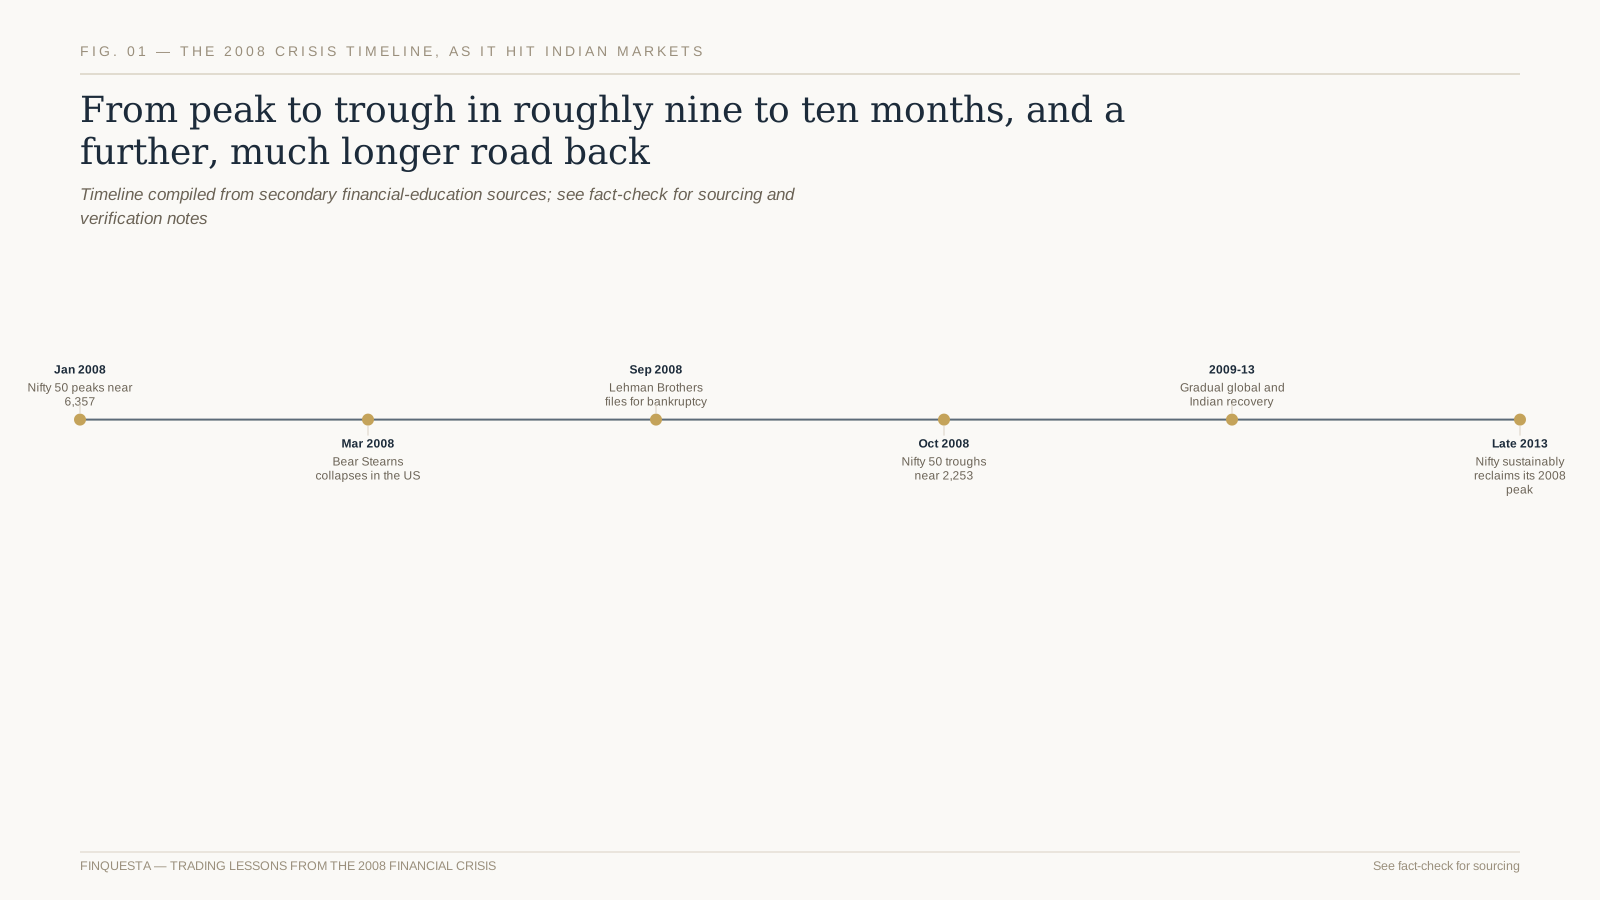
Fig. 01 — From a January 2008 peak to an October 2008 trough, and a multi-year road back
The crisis didn’t arrive as a single event but unfolded over roughly a year, with a handful of specific moments widely cited as its turning points, each worth understanding for how they connect to what Indian markets experienced.
Bear Stearns, a major US investment bank, collapsed and was acquired in a rushed, distressed sale in March 2008 — an early, serious warning sign that the credit stress building in the US mortgage market was capable of threatening large, established financial institutions.
Lehman Brothers, another major US investment bank, filed for bankruptcy in September 2008 — widely regarded as the single most consequential event of the crisis, since it demonstrated that a systemically significant institution could actually be allowed to fail, sharply escalating global risk aversion within days.
Indian markets, per the specific figures covered in the next section, reached their crisis-period low the following month, October 2008, broadly consistent with the global panic that followed Lehman’s collapse, before a slow, multi-year recovery began.
This timeline is a simplified version of a considerably more complex year of events across global markets — it captures the moments most consistently cited in retrospective analysis, not an exhaustive account of everything that happened across 2008’s financial system.
For an Indian retail investor following markets in real time during 2008, the timeline likely felt considerably less tidy than this retrospective summary suggests — information arrived in fragments, initial reactions to each event were often uncertain or contradictory, and the full scale of what was unfolding globally only became clear in hindsight, a pattern common to how most genuine crises are actually experienced as they happen.
How Indian equity markets were specifically hit
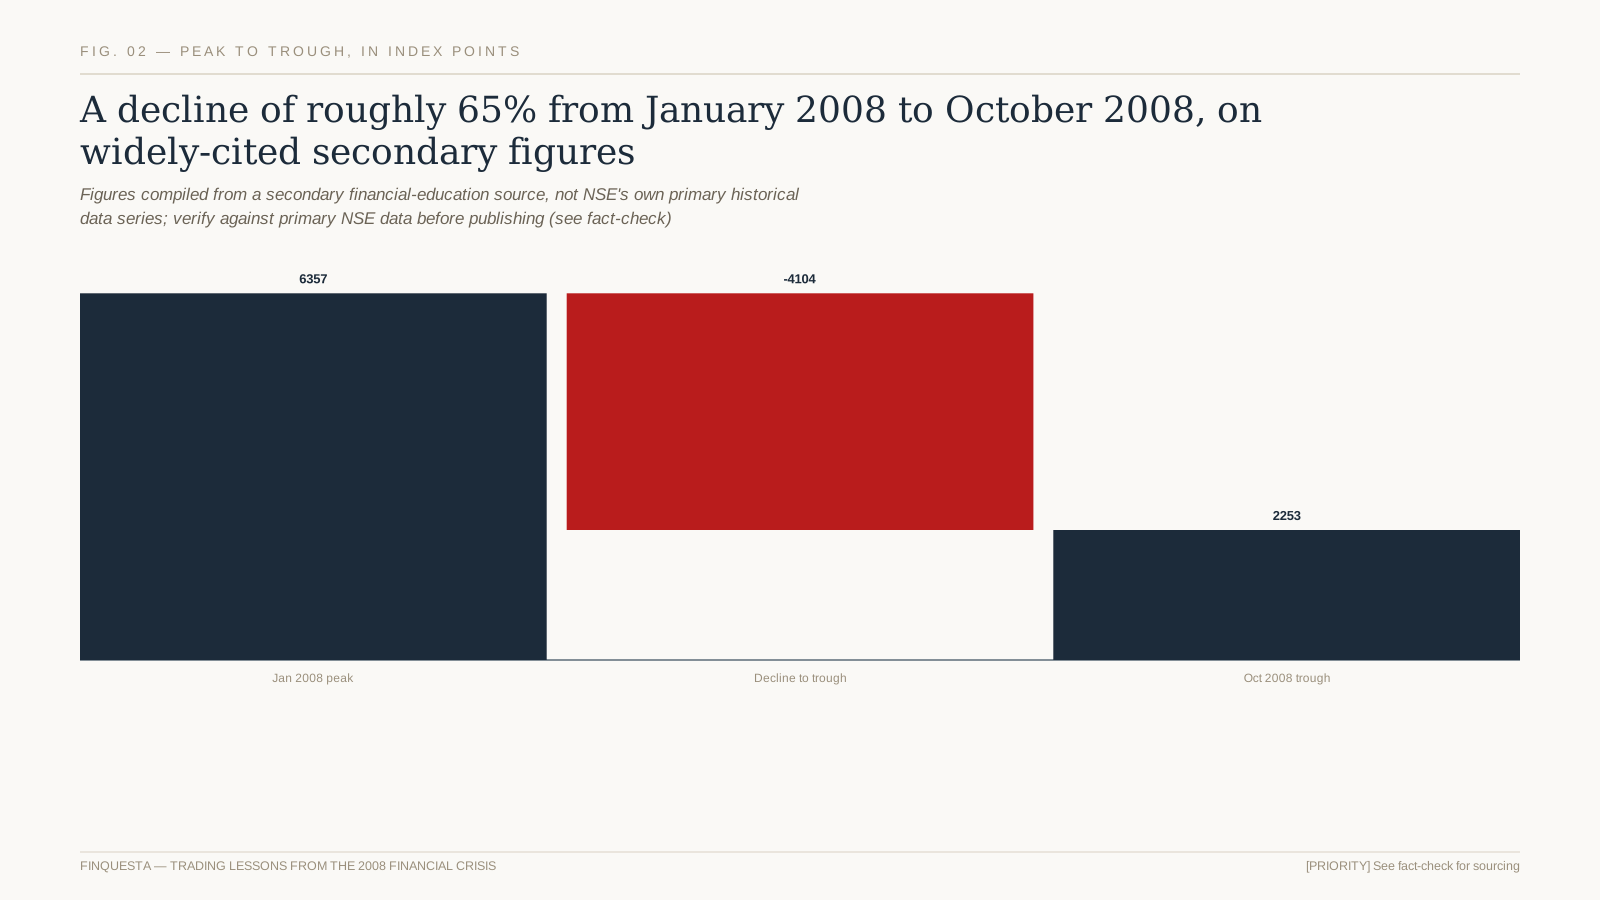
Fig. 02 — A decline of roughly 65% from the January 2008 peak to the October 2008 trough, per secondary sourcing
According to secondary financial-education sourcing compiled for this article, the Nifty 50 peaked near 6,357 in January 2008 and fell to roughly 2,253 by October 2008 — a decline in the broad neighbourhood of 65% over nine to ten months.
Beyond the headline index decline, the same period saw measurable broader economic strain: India’s GDP growth rate slowed from roughly 7.8% to roughly 5.8% around the crisis period, the rupee depreciated to around Rs 49 to the US dollar by October 2008, and exports reportedly declined by around 13% during 2008, according to the secondary sources reviewed for this article.
Foreign institutional investor selling was a significant contributor to the Indian market decline specifically, as global investors broadly pulled capital from emerging markets to address liquidity needs and reduce risk exposure elsewhere in their portfolios, a pattern covered in more depth later in this article’s discussion of liquidity.
It’s worth being explicit that these are approximate, secondary-sourced figures assembled for a general education context, not a precise academic reconstruction — the broad magnitude (a decline in the roughly 60-65% range) is widely and consistently cited, even where exact peak and trough figures vary slightly by source and by which specific date is used.
It’s also worth separating the index-level decline from the considerably wider dispersion of outcomes across individual stocks during the same period — some heavily leveraged or fundamentally weaker companies fell by far more than the headline index figure and, in some cases, never fully recovered even after the broader index reclaimed its prior peak, a reminder that index-level statistics can understate single-stock risk.
The Correlation Convergence
ORIGINAL FINQUESTA CONCEPT — The Correlation Convergence is Finquesta’s framework for one of the most consistently observed patterns across genuine systemic crises, 2008 included: in calm markets, different asset classes, sectors, and geographies show low or even negative correlation to each other, which is exactly what makes diversification effective under normal conditions. During a genuine systemic crisis, correlations across almost all risk assets tend to converge sharply toward each other — everything falls together — precisely when diversification’s protective effect is needed most and delivers least. This isn’t a flaw in diversification as a concept; it’s a specific, well-documented limitation worth understanding rather than discovering for the first time during an actual crisis.
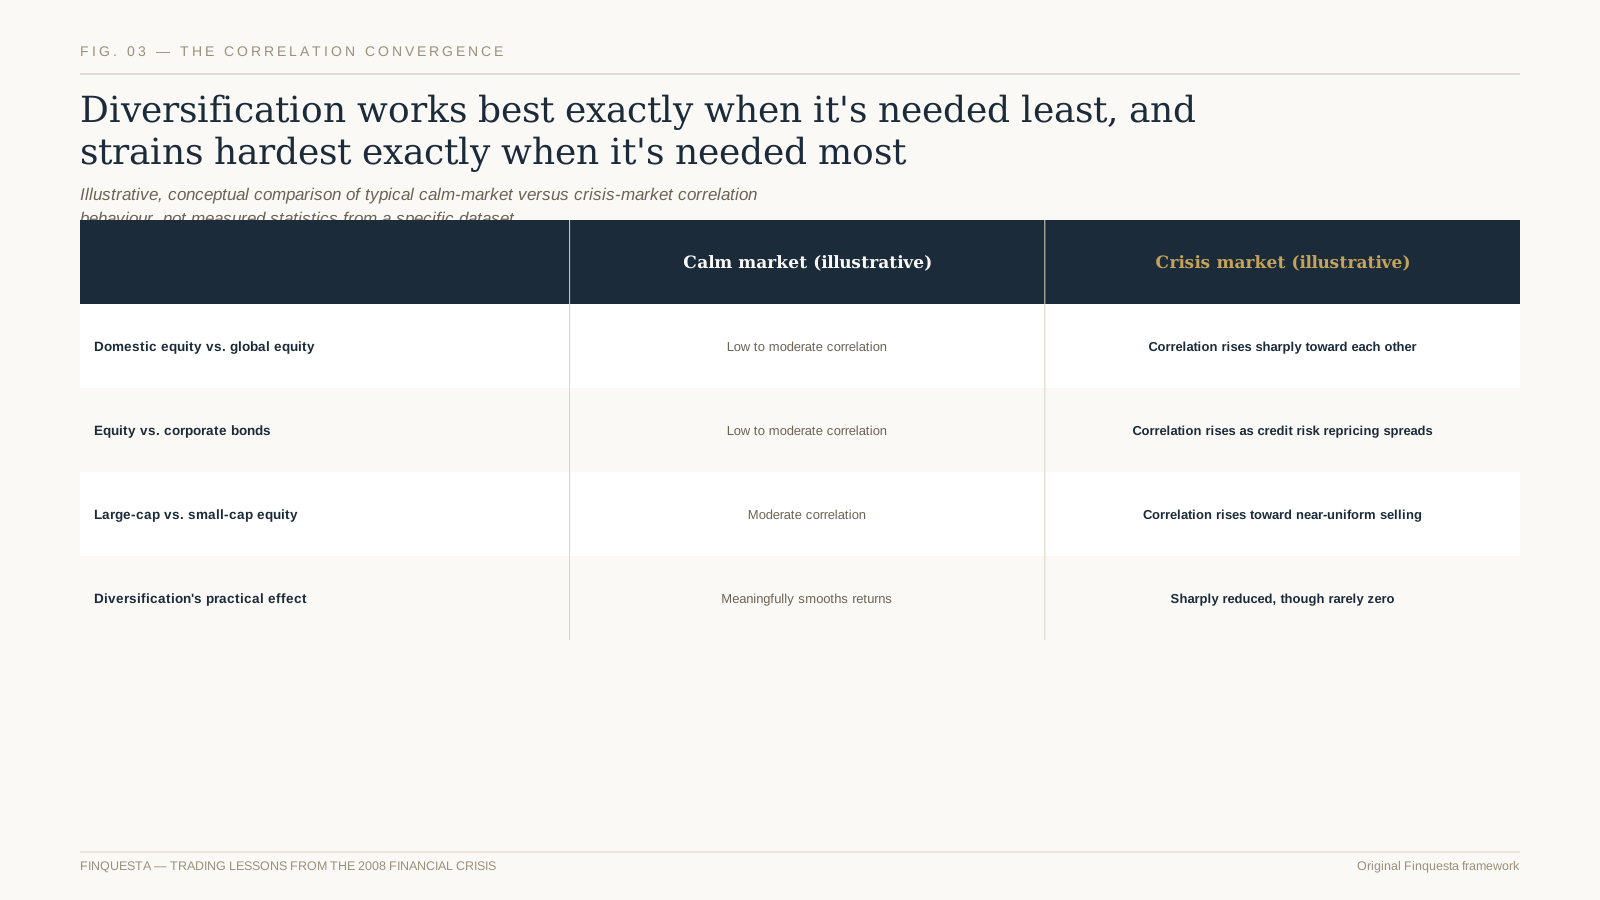
Fig. 03 — Diversification’s protective effect narrows sharply during a genuine systemic crisis
The mechanism behind this convergence is broadly consistent across different crises: when systemic fear rises sharply, investors and institutions facing genuine liquidity pressure tend to sell whatever can be sold, across asset classes and geographies, rather than selectively — the immediate need for cash overrides the more selective reasoning that governs calmer-market decisions.
This doesn’t mean diversification becomes worthless during a crisis — it means its protective effect narrows meaningfully rather than disappearing entirely, and different asset classes still typically decline by different magnitudes even during convergence, just with a smaller gap between them than calm-market correlations would suggest.
This is precisely why a genuinely diversified portfolio, built with the Correlation Convergence in mind, doesn’t rely on diversification alone as its only risk-management tool — position sizing, cash reserves, and a realistic understanding of how much protection diversification actually provides during the worst-case scenario all matter alongside it.
It’s worth internalising this pattern specifically before it’s needed, rather than during an actual crisis, since discovering for the first time that your “diversified” portfolio is falling almost as a single unit is a considerably worse moment to first learn this lesson than reading about it here.
The Liquidity Mirage
ORIGINAL FINQUESTA CONCEPT — The Liquidity Mirage is Finquesta’s framework for a second, related pattern: in normal market conditions, the ability to sell a position at close to its last-traded price looks like a constant, always-available feature of markets — a background assumption most investors never have reason to question. In a genuine crisis, that assumed liquidity can evaporate exactly when it’s needed most, as bid-ask spreads widen sharply and willing buyers become scarce at anything resembling recent prices, forcing sales at levels meaningfully worse than the last quoted price suggested. The liquidity investors had implicitly assumed was always available turns out, in a genuine crisis, to have been a feature specific to calm conditions — a mirage that recedes precisely when an investor most needs to rely on it.
This pattern showed up across global markets during 2008 in several forms: widening spreads even in normally liquid instruments, forced sales by leveraged institutions needing to raise cash quickly regardless of price, and a general reluctance among market participants to be the buyer on the other side of a stressed seller’s trade.
For an individual retail investor, the Liquidity Mirage matters less in the form of literally being unable to sell — most listed Indian equities remained tradeable throughout 2008 — and matters more in the form of the price actually realised on a forced or panicked sale being considerably worse than a calm-market price would have been.
A leveraged position specifically amplifies the Liquidity Mirage’s impact, since a margin call arriving during exactly this kind of liquidity-stressed period can force a sale at a genuinely unfavourable price, with no ability to wait for conditions to normalise — a dynamic covered in more detail in the context of margin trading specifically.
The practical lesson isn’t that markets are permanently untrustworthy — it’s that the liquidity available during calm periods shouldn’t be assumed to hold under genuine stress, which has direct implications for how much leverage, and how large a forced-sale-vulnerable position, is prudent to carry at any given time.
What “flight to safety” actually looked like
“Flight to safety” describes the pattern of capital moving from riskier assets toward perceived safer havens during a crisis — government bonds, gold, and cash being the most commonly cited destinations, each for slightly different reasons.
Gold’s specific historical relationship with equity markets during periods of acute stress, including how consistently that relationship has held across different crises and where it has genuine limits, is covered in dedicated detail elsewhere, since it deserves more careful treatment than a brief mention here can provide.
Government bonds, particularly from perceived stable sovereign issuers, also typically see increased demand during a flight to safety, reflecting a preference for capital preservation and predictable, if modest, returns over the higher but considerably less certain returns available from riskier assets during the same period.
It’s worth noting that “flight to safety” assets aren’t uniformly safe in every crisis or across every time horizon — they’re safer relative to the specific risks investors are fleeing in that specific crisis, a distinction worth remembering rather than treating any single asset class as universally, permanently safe under all conditions.
A related, easily overlooked point is that a genuine flight to safety can itself distort prices in the destination assets — a sudden surge of demand for perceived safe havens can push their prices to levels that look expensive in hindsight once the crisis passes, meaning a mechanical shift into “safe” assets purely because a crisis is underway carries its own risk of buying at a temporarily elevated price.
Forced selling and margin calls during the crisis
Leveraged positions faced a particularly severe version of the crisis’s dynamics: as asset prices fell sharply, margin requirements on existing leveraged positions were breached, triggering margin calls that, if unmet, resulted in forced liquidation at exactly the depressed prices the crisis had already produced.
This forced selling itself became a contributing factor to the decline’s severity in some markets and instruments — leveraged sellers forced to sell regardless of price added further downward pressure, which could trigger further margin calls elsewhere, a self-reinforcing dynamic during the most acute phases of the crisis.
This is a specific, historically documented illustration of why margin trading carries materially different risk than unleveraged investing during genuine systemic stress — the forced, price-insensitive nature of a margin-driven liquidation is structurally different from a voluntary decision to sell at a time of an investor’s own choosing.
For an investor evaluating leverage today, 2008’s forced-selling dynamic is a concrete historical illustration worth weighing specifically against the theoretical benefits leverage offers during calmer periods, rather than evaluating leverage’s risk only against typical, non-crisis market conditions.
It’s worth distinguishing forced selling from a deliberate, planned reduction in risk exposure decided in advance — the latter, executed on an investor’s own schedule and judgement, is a normal and often prudent part of risk management, while the former, triggered mechanically by a margin call at the worst possible moment, offers no such choice.
How long recovery actually took vs. how it felt in the moment
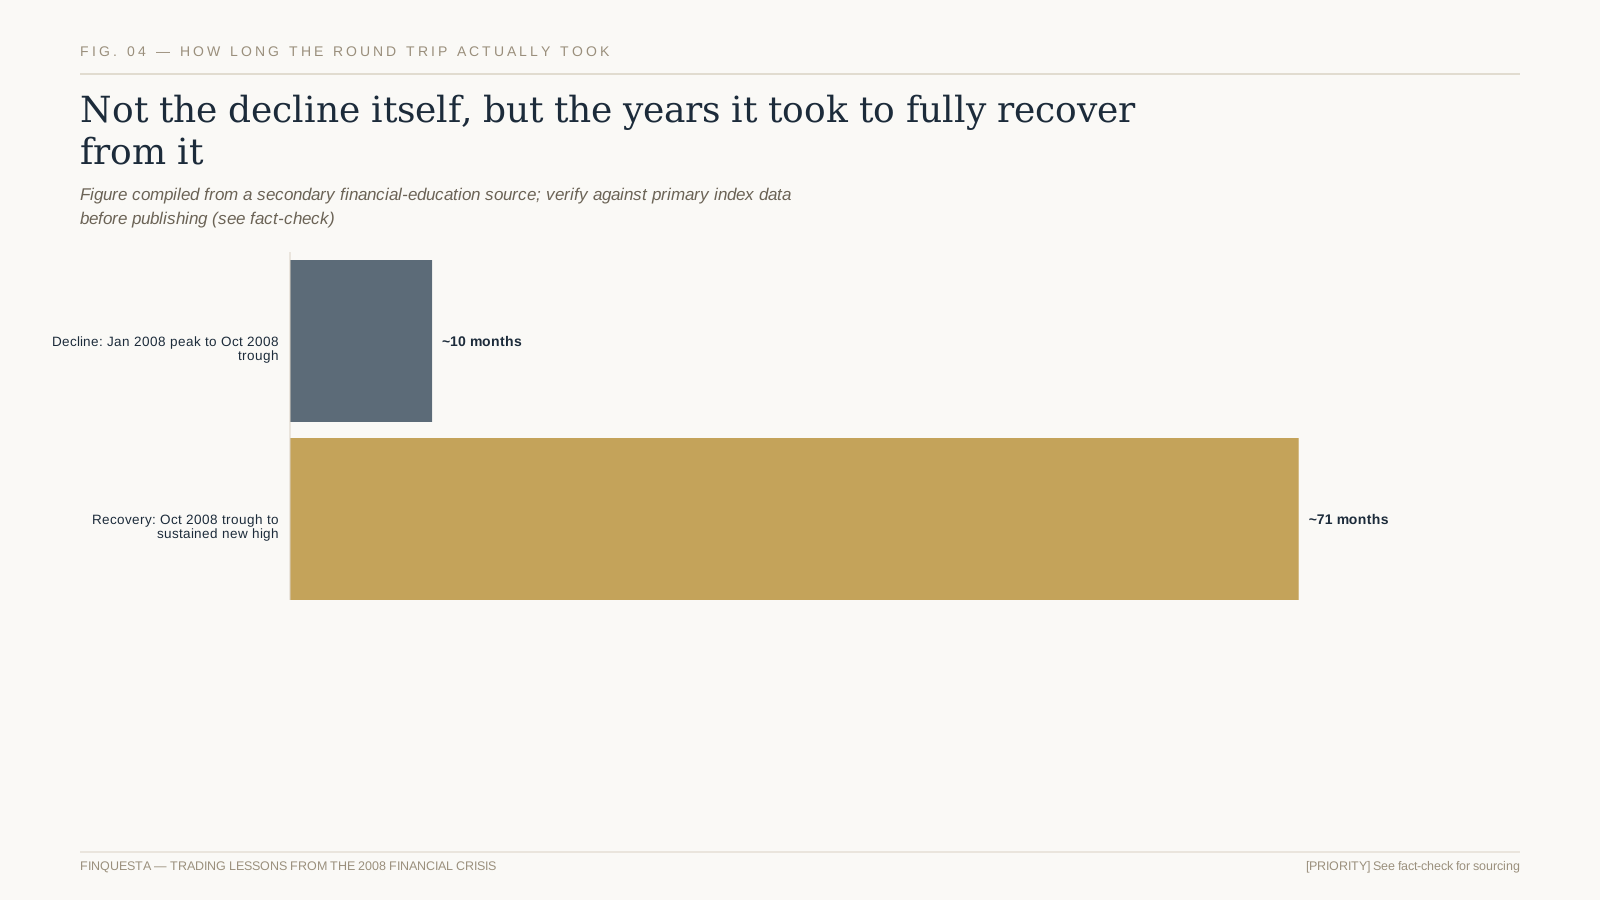
Fig. 04 — Roughly 71 months from the October 2008 trough to a sustained new high, per secondary sourcing
According to the secondary sourcing reviewed for this article, the Nifty 50 didn’t sustainably reclaim its January 2008 peak until roughly late 2013 or early 2014 — a round trip of approximately 71 months from the October 2008 trough, considerably longer than the roughly nine-to-ten-month decline that preceded it.
This asymmetry — a relatively fast, sharp decline followed by a much slower, more gradual recovery — is a pattern that recurs across many, though not all, major market declines, and it has a direct behavioural implication: an investor who panic-sold near the October 2008 trough, then waited for confidence to fully return before re-entering, likely missed a meaningful share of the eventual recovery.
It’s worth being clear that this recovery-time figure describes one specific index over one specific historical period — it isn’t a rule that every future decline will take a similar multiple of the decline period to recover, and this article doesn’t present it as one.
The more durable, transferable lesson isn’t the specific 71-month figure itself, but the underlying pattern it illustrates: recovery from a genuine systemic decline has historically taken considerably longer, and felt far less linear in the moment, than the decline itself — a useful expectation to hold going into any future period of serious market stress.
How 2008 compares to other major Indian market drawdowns
2008 wasn’t the only sharp decline Indian equity markets have experienced in recent decades, and a brief comparison to two other widely cited episodes — the 2000 dot-com-era decline and the 2020 COVID-19 crash — helps place 2008’s specific characteristics in a broader context rather than treating it as a template for every future crisis.
The 2020 COVID-19 crash produced a similarly sharp, fast decline over a few weeks in February and March 2020, including a trading halt triggered by a market-wide circuit breaker, but the subsequent recovery to a sustained new high was considerably faster than 2008’s roughly 71-month round trip — commonly cited at around a year, though this specific comparison figure should be treated as approximate pending verification against primary index data.
The 2000-2001 dot-com-era decline in Indian markets was comparatively more concentrated in technology and IT-services names specifically, reflecting a valuation correction in one sector more than a systemic credit-system failure — a meaningfully different type of crisis from 2008’s broad, cross-sector transmission mechanism.
The practical takeaway from this comparison isn’t a ranking of which crisis was “worse,” but a reminder that decline speed and recovery speed aren’t reliably linked to each other, and that the specific mechanism behind a decline — systemic credit failure, sector-specific valuation correction, or an exogenous shock like a pandemic — meaningfully shapes how the recovery unfolds afterward.
Behavioural mistakes investors made — and keep making
Panic-selling near the bottom is the most commonly cited behavioural mistake associated with 2008, and it’s a genuinely understandable one: the sharpest declines tend to occur precisely when fear and uncertainty are at their peak, which is exactly when selling feels most urgent and holding feels most difficult.
A second common mistake was waiting for “certainty” before re-entering the market — holding out for a clear signal that the worst was over, which by definition only becomes available well after a meaningful portion of the recovery has already happened, since markets typically move ahead of confirmed economic data.
A third mistake, less discussed but equally consequential, was abandoning a systematic investment discipline — stopping SIPs or regular contributions specifically during the downturn, when lower prices were, mechanically, buying more units for the same contribution, precisely the opposite of what panic-driven behaviour led many investors to do.
None of these mistakes were unique to 2008 — broadly similar behavioural patterns have recurred in other periods of market stress, before and since, which is part of why understanding them through a specific, well-documented historical episode like 2008 has value well beyond that one crisis alone.
It’s also worth noting that these behavioural mistakes aren’t a matter of intelligence or sophistication — professional fund managers and institutional desks made broadly similar errors during 2008 in various forms, which is part of why behavioural discipline is better treated as a structural, process-driven problem to design around rather than something solved purely through willpower or market knowledge.
A disciplined SIP investor vs. a lump-sum investor through 2008
An investor who had been running a systematic, regular SIP through 2008, and who continued it without interruption through the decline, was mechanically buying units at progressively lower prices as the index fell — precisely the buy-low behaviour that’s difficult to execute deliberately but happens automatically through an uninterrupted SIP.
A lump-sum investor whose entire investment happened to be made right at or near the January 2008 peak faced a meaningfully different experience — the full capital exposed to the entire decline at once, with the eventual recovery timeline mattering enormously more to that investor’s realised outcome than to the SIP investor’s averaged-in position.
This isn’t a claim that SIP investing eliminates risk or guarantees a better outcome than lump-sum investing in every scenario — it’s a specific illustration of how a systematic, regular contribution pattern behaves differently during a sharp decline than a single, poorly-timed lump-sum entry, purely as a matter of averaging mechanics.
The practical lesson generalises beyond 2008 specifically: uncertainty about market timing is a genuine, permanent feature of investing, not something unique to crisis periods, and a systematic contribution approach is one structural way to reduce a single bad-timing decision’s impact on the eventual outcome.
A third useful comparison point is a lump-sum investor who, rather than investing everything at the January 2008 peak, happened to deploy capital near or after the October 2008 trough — that investor’s realised outcome depended enormously on a timing decision that, in practice, is essentially impossible to make deliberately and reliably in advance, reinforcing why systematic, time-diversified entry is generally preferred over attempting to time a single optimal entry point.
Regulatory and circuit-breaker responses since 2008
Global and Indian financial regulation evolved meaningfully in the years following 2008, with tighter bank capital requirements, closer scrutiny of systemic risk, and refinements to market circuit-breaker mechanisms among the broad categories of change generally attributed, at least in part, to lessons drawn from the crisis.
Circuit breakers — mechanisms that pause trading automatically when an index moves beyond a defined threshold in a single session — existed in some form before 2008 in Indian markets, but the broader global regulatory conversation around market stability mechanisms intensified significantly in the years following the crisis.
It’s worth being cautious about overstating how much any specific regulatory change directly traces to 2008 versus reflecting a broader, ongoing evolution of market infrastructure — this article presents the general direction of post-2008 regulatory tightening as background context, not as a claim that any specific current rule was created solely because of the 2008 crisis.
For a retail investor today, the practical relevance of this regulatory evolution is less about memorising specific rule changes and more about recognising that market infrastructure has continued adapting in response to observed stress events — a reasonable, general expectation, though not a guarantee that any specific future crisis will play out identically to 2008.
None of this regulatory evolution should be read as a claim that systemic crises have become impossible or even meaningfully less likely — tighter rules generally aim to reduce the probability or severity of certain failure modes observed in 2008 specifically, not to eliminate systemic risk from financial markets altogether, which remains a structural feature of any sufficiently interconnected financial system.
What individual investors could and couldn’t control during the crisis
The macro trigger, timing, depth, and duration of a systemic crisis like 2008 sit entirely outside any individual investor’s control — no amount of research, discipline, or skill lets an ordinary retail investor influence when the next credit crisis begins or how severe it turns out to be.
What does sit within an individual investor’s control is decided largely before a crisis ever begins: the asset allocation carried into it, the amount of leverage employed, the size of an accessible emergency cash reserve, and whether a systematic contribution plan is structured to continue automatically rather than requiring a fresh, emotionally loaded decision every month.
Whether to interrupt or continue a SIP during an actual downturn is also squarely within an investor’s control, and 2008 illustrates concretely how much this specific, controllable choice affected eventual outcomes relative to investors who paused contributions near the bottom out of fear.
A useful practical reframe during genuine market stress is to consciously separate what’s actually happening in markets from what remains within personal control — it’s the second category, not the first, that connects directly to a calmer, more disciplined response, and it’s also the only category worth spending decision-making energy on once a crisis is already underway.
How these 2008 lessons apply to portfolio construction today
The Correlation Convergence lesson translates directly into a portfolio-construction principle worth applying today: build diversification with the explicit expectation that its protective effect will narrow during a genuine crisis, rather than assuming today’s calm-market correlations will hold under future stress.
The Liquidity Mirage lesson translates into a leverage and position-sizing principle: size leveraged positions, and maintain cash reserves, with the specific scenario of a liquidity-stressed forced sale in mind, not just the more common, calmer-market scenario where an orderly exit at a reasonable price is genuinely available.
The behavioural lessons translate into a discipline principle: a written investment plan, decided in advance during a calm period, is considerably more likely to be followed during genuine stress than a plan improvised in the moment, when fear is at its highest and clear thinking is hardest to sustain.
None of these principles guarantee protection against every future crisis, since no historical case study can — they represent a specific, well-documented set of lessons worth incorporating into portfolio construction and personal investing discipline, applied prospectively rather than only understood in hindsight.
What hasn’t changed since 2008 vs. what has
Human behaviour under acute financial stress — fear-driven selling, a preference for certainty before re-entering, difficulty maintaining discipline during a sharp decline — appears, based on the broader pattern of market history before and after 2008, to be a durable, recurring feature rather than something regulation or technology has eliminated.
What has changed includes market infrastructure, regulatory oversight, and the speed and volume of available information — investors today have access to real-time data and analysis that 2008-era investors largely didn’t, though it’s worth noting that more information doesn’t automatically translate into better-calibrated behaviour during genuine stress.
It’s also worth acknowledging genuine uncertainty about how a future systemic crisis, if one occurs, would specifically unfold — the broad behavioural and structural lessons from 2008 are reasonably transferable, but the specific triggers, mechanics, and severity of any future crisis remain fundamentally unpredictable in advance.
This combination — durable behavioural patterns alongside evolving market structure — is why studying 2008 specifically remains useful well beyond its own historical moment: the structural details of the next crisis will likely differ, but the behavioural lessons about diversification limits, liquidity assumptions, and disciplined process have a stronger claim to staying relevant.
Taken together, these two categories — durable human behaviour and evolving market structure — argue for a specific kind of humility when preparing for future stress: build a plan that accounts for how you’re likely to actually feel and behave under pressure, rather than a plan that assumes a more purely rational version of yourself will show up when it matters most.
A brief self-check for your own crisis preparedness
None of the lessons in this article require predicting when or how the next period of serious market stress will arrive. They translate into a short, practical self-check worth running against your own current portfolio and plan.
- Confirm your portfolio’s diversification assumptions account for the Correlation Convergence, not just calm-market correlations.
- Check whether any leveraged positions could survive a genuinely liquidity-stressed forced-sale scenario, not just an orderly one.
- Write down, in calm conditions, what you intend to do — and not do — during the next sharp, sustained decline.
- Confirm any systematic contributions (SIPs) are set up to continue automatically through a downturn, not requiring a fresh decision each month to keep going.
- Revisit this self-check periodically, since portfolios and leverage levels can drift from an original, more conservative plan over time.
None of these steps require forecasting the next crisis’s specific cause or timing. They require applying 2008’s most durable, well-documented lessons to your own current situation, before rather than during the next period of genuine market stress.
None of this is meant to suggest that preparing for a future crisis is primarily about pessimism or constant vigilance — most of the preparation described here is a one-time or periodic exercise, done in calm conditions, that then largely runs on its own through automatic contributions, pre-set allocation limits, and a written plan referred to only when genuinely needed.
| HISTORICAL EDUCATION, NOT A FORECAST OR INVESTMENT ADVICE This article is a historical case study of the 2008 financial crisis’s impact on Indian markets, using figures compiled from secondary sources and flagged for verification. It is general financial education, not a prediction of any future crisis, and not personalised investment advice. |
Trading lessons from the 2008 financial crisis: frequently asked questions
How much did Indian markets fall during the 2008 financial crisis?
According to secondary financial-education sourcing, the Nifty 50 fell from approximately 6,357 in January 2008 to approximately 2,253 in October 2008, a decline of roughly 65% over nine to ten months. This figure should be verified against primary NSE data before being treated as precise.
How long did it take Indian markets to recover from the 2008 crash?
Per the same secondary sourcing, the Nifty 50 did not sustainably reclaim its January 2008 peak until roughly late 2013 or early 2014 — a recovery period of approximately 71 months from the October 2008 trough, considerably longer than the decline itself.
What is the Correlation Convergence?
It’s Finquesta’s framework describing how correlations between different asset classes, which are typically low in calm markets, tend to rise sharply toward each other during a genuine systemic crisis — reducing diversification’s protective effect exactly when it’s needed most.
What is the Liquidity Mirage?
It’s Finquesta’s framework describing how the ability to sell an asset near its last quoted price, which feels constant during calm markets, can evaporate during a genuine crisis as spreads widen and buyers become scarce, forcing sales at considerably worse prices than expected.
What triggered the 2008 global financial crisis?
The crisis originated in the US mortgage and credit markets and escalated with the collapse of major financial institutions, including Bear Stearns in March 2008 and Lehman Brothers’ bankruptcy in September 2008, which sharply accelerated global risk aversion and market declines.
Did SIP investors do better than lump-sum investors during 2008?
An investor running an uninterrupted SIP through the 2008 decline was mechanically buying more units at progressively lower prices, unlike a lump-sum investor whose full capital was exposed to the entire decline at once. This illustrates averaging mechanics, not a guarantee of a better outcome in every scenario.
What is a common investor mistake seen during the 2008 crisis?
Panic-selling near the market bottom and then waiting for full certainty before re-entering are the most commonly cited mistakes, since both tend to lock in losses near the trough and delay participation in the recovery that follows.
Does gold protect a portfolio during a financial crisis like 2008?
Gold has historically behaved differently from equities during some periods of market stress, though this article covers that specific relationship, including its limits, in dedicated detail elsewhere rather than asserting a simple guarantee here.
How does leverage affect risk during a systemic crisis?
Leveraged positions faced forced margin-call liquidations during 2008, often at severely depressed prices, since the Liquidity Mirage meant an orderly, well-timed exit wasn’t reliably available. This is a specific historical illustration of leverage’s amplified risk during genuine systemic stress.
Is a crisis like 2008 likely to happen again?
This article doesn’t forecast future crises, since their timing, trigger, and severity are fundamentally unpredictable in advance. It uses 2008 as a historical case study for durable lessons about diversification limits, liquidity, and investor behaviour rather than a prediction of what comes next.
What should I actually do differently based on 2008’s lessons?
Build diversification expecting its protective effect to narrow during genuine stress, size leverage and cash reserves with a liquidity-stressed scenario in mind, and write down an investment plan during calm conditions rather than improvising one during acute market fear.
Were Indian markets affected by a crisis that started in the US?
Yes. Indian markets were affected primarily through foreign institutional investor selling, tightening global credit and trade conditions, and broader global risk aversion, even though the crisis’s direct origin was in the US mortgage and banking system rather than in India itself.
Disclaimer This article is for informational and educational purposes only and does not constitute financial, investment, tax, or legal advice. Figures, rates, and regulations mentioned are subject to change; please verify current details with official sources (RBI, SEBI, the Income Tax Department, IRS, or a licensed financial advisor) before making financial decisions. Finquesta may earn a commission from affiliate links in this article at no extra cost to you.