What Is VWAP? The Simple, Complete Friendly Guide (2026)

what is vwap

A trader two desks over keeps buying at prices that look worse than what the trader next to him is paying — same stock, same minute. By 3:30pm, his fills average out cheaper. He wasn’t guessing. He was trading against a number most beginners never look at, and it isn’t complicated once you see where it comes from.

QUICK DEFINITION VWAP (Volume-Weighted Average Price) is the average price a stock has traded at during the current session, weighted by how much volume traded at each price. It resets to zero at every market open, is calculated automatically on virtually every trading terminal, and is used mainly to judge whether an order was filled at a fair price relative to the rest of the day’s activity — not to predict where price goes next.

What is VWAP, and why does it exist?

Every stock trades at dozens or hundreds of different prices across a single session. A simple average of the day’s high and low tells you almost nothing about where most of the actual trading happened. VWAP fixes that by weighting each price by the volume that traded there — a price with ten times the volume counts ten times more.

It was built for institutional trading desks first, not retail traders. A mutual fund that needs to buy a large block of shares can’t dump the whole order in one second without moving the price against itself, so it spreads the order through the day and later checks: did our average fill price beat VWAP? That single comparison is still the industry’s default execution benchmark.

Retail traders adopted it later, mostly as a quick visual cue for intraday bias — price above VWAP is loosely read as the buyers being in control for the session, price below as the sellers being in control. That’s a simplification worth treating carefully, which this article gets to shortly.

This is also the number active traders check first thing when a stock has been halted and reopened, or after an unusually large single print — a fresh VWAP anchored from the reopen, or a clear outlier trade sitting far from the rest of the session’s volume, tells you at a glance whether the broader market has actually accepted the new price or is still fighting it.

The formula behind VWAP

Picture a stock that trades 10,000 shares at ₹100 in the first minute, then 90,000 shares at ₹101 in the next. A simple average of those two prices is ₹100.50. VWAP, weighting by the 90,000-share print, lands at ₹100.90 — much closer to where the real volume actually happened, and a more honest read of where the market really was.
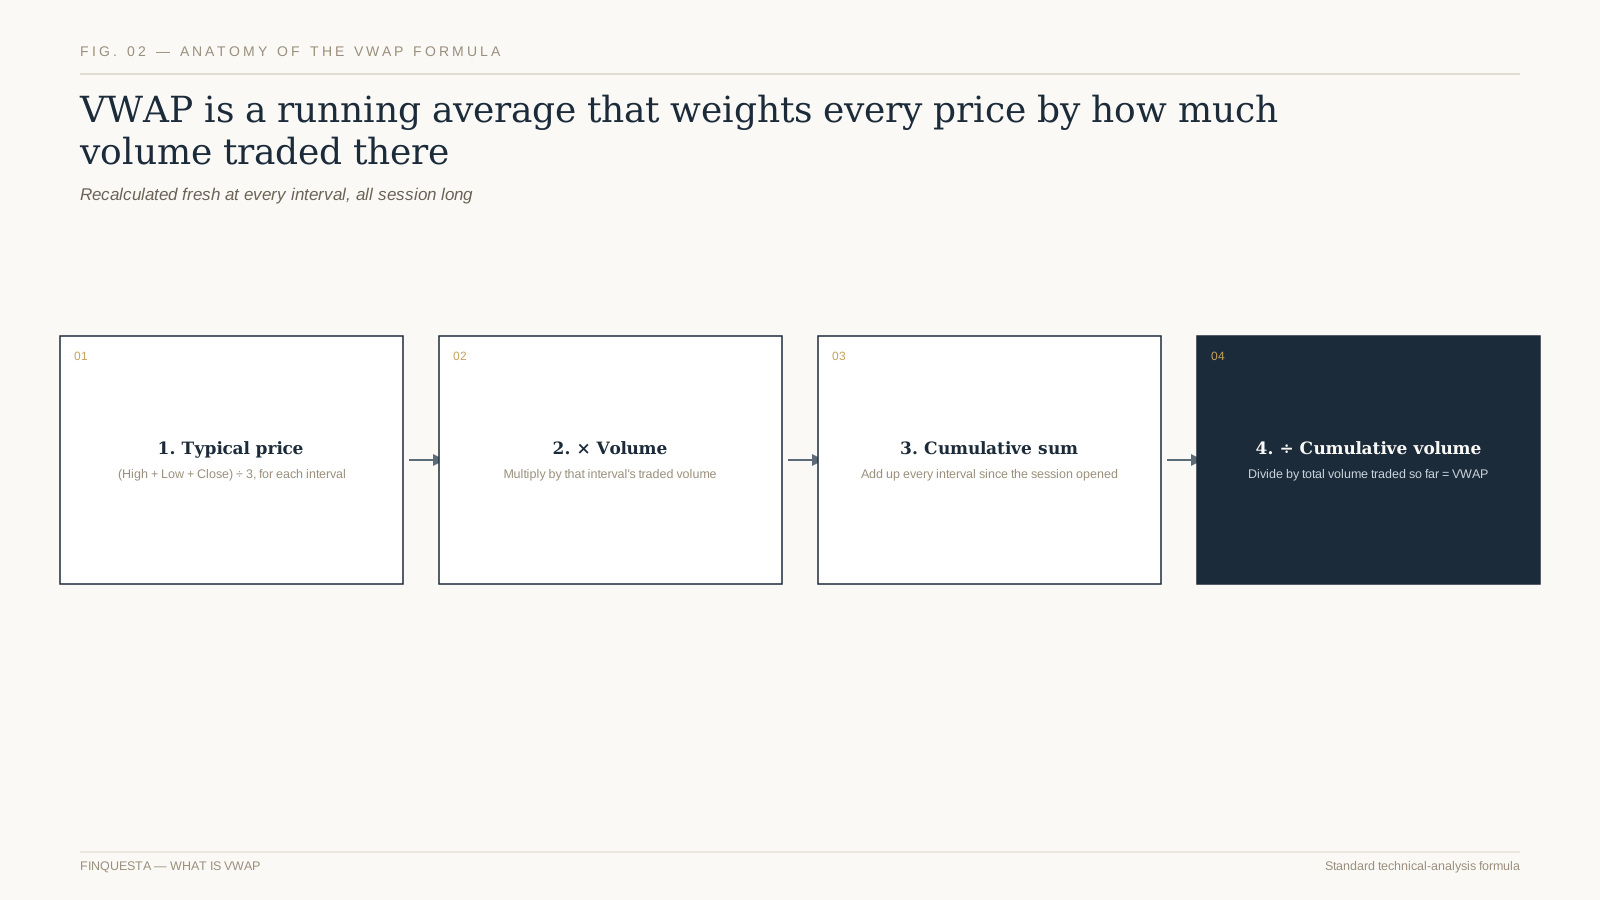
Fig. 01 — VWAP is cumulative price-times-volume divided by cumulative volume, recalculated every interval

For each interval — a minute, five minutes, whatever the chart’s resolution is — the platform computes a typical price (usually high plus low plus close, divided by three), multiplies it by that interval’s volume, and adds the result to a running total. Divide that running total by the running total of volume, and you have the current VWAP.

You will never need to calculate this by hand. Every serious charting platform — from a broker’s own app to TradingView — plots VWAP as a built-in line. What’s worth understanding is not the arithmetic but why it behaves the way it does, which the rest of this article covers.

Notice what the formula does NOT include: it never asks why a trade happened, who placed it, or whether it was a genuine directional bet or a market-maker hedging some other position. VWAP is purely descriptive — a clean summary of where volume actually transacted, with zero opinion baked in about whether that was smart money or noise.

The Anchor Reset — why VWAP starts fresh every single day

ORIGINAL FINQUESTA CONCEPT — The Anchor Reset  names the single most misunderstood fact about VWAP: it has no memory across sessions. Unlike a 50-day moving average, which carries information from weeks ago, VWAP restarts from zero at every market open — so comparing today’s VWAP level to yesterday’s is comparing two unrelated calculations that happen to share a name.

This is precisely why VWAP is an intraday tool by design, not a swing-trading or positional one. A trader who tries to read a multi-day trend into a VWAP line is fighting the tool’s own architecture — there’s a reason charting platforms don’t even offer a meaningful “5-day VWAP” line by default.

Anchored VWAP is the one legitimate workaround, and it’s worth knowing separately: instead of anchoring to the day’s open, a trader manually anchors the calculation to a specific event — an earnings date, a breakout candle, a swing low — and lets VWAP run cumulatively from that chosen point onward. That’s a genuinely different, more advanced tool wearing the same name.

Some charting platforms offer a “previous day’s VWAP” as a static reference line carried into today’s session — that’s a legitimate, deliberately different tool, not standard VWAP pretending to have memory. Know which one your platform is actually showing you before you build a rule around it.

Worth remembering before you rely on any single-session anchor: a stock that gapped up sharply overnight on genuine news has, technically, a fresh VWAP that says almost nothing about where it traded yesterday — which is exactly correct behaviour for a tool meant to describe today, not carry yesterday’s baggage forward.

How institutional desks actually use VWAP

This is worth internalising precisely because it reframes what VWAP is for. It isn’t a crystal ball for where a stock is headed — it’s an accountability tool for how well an order was executed relative to the rest of the market’s activity that same day, a completely different job from prediction.
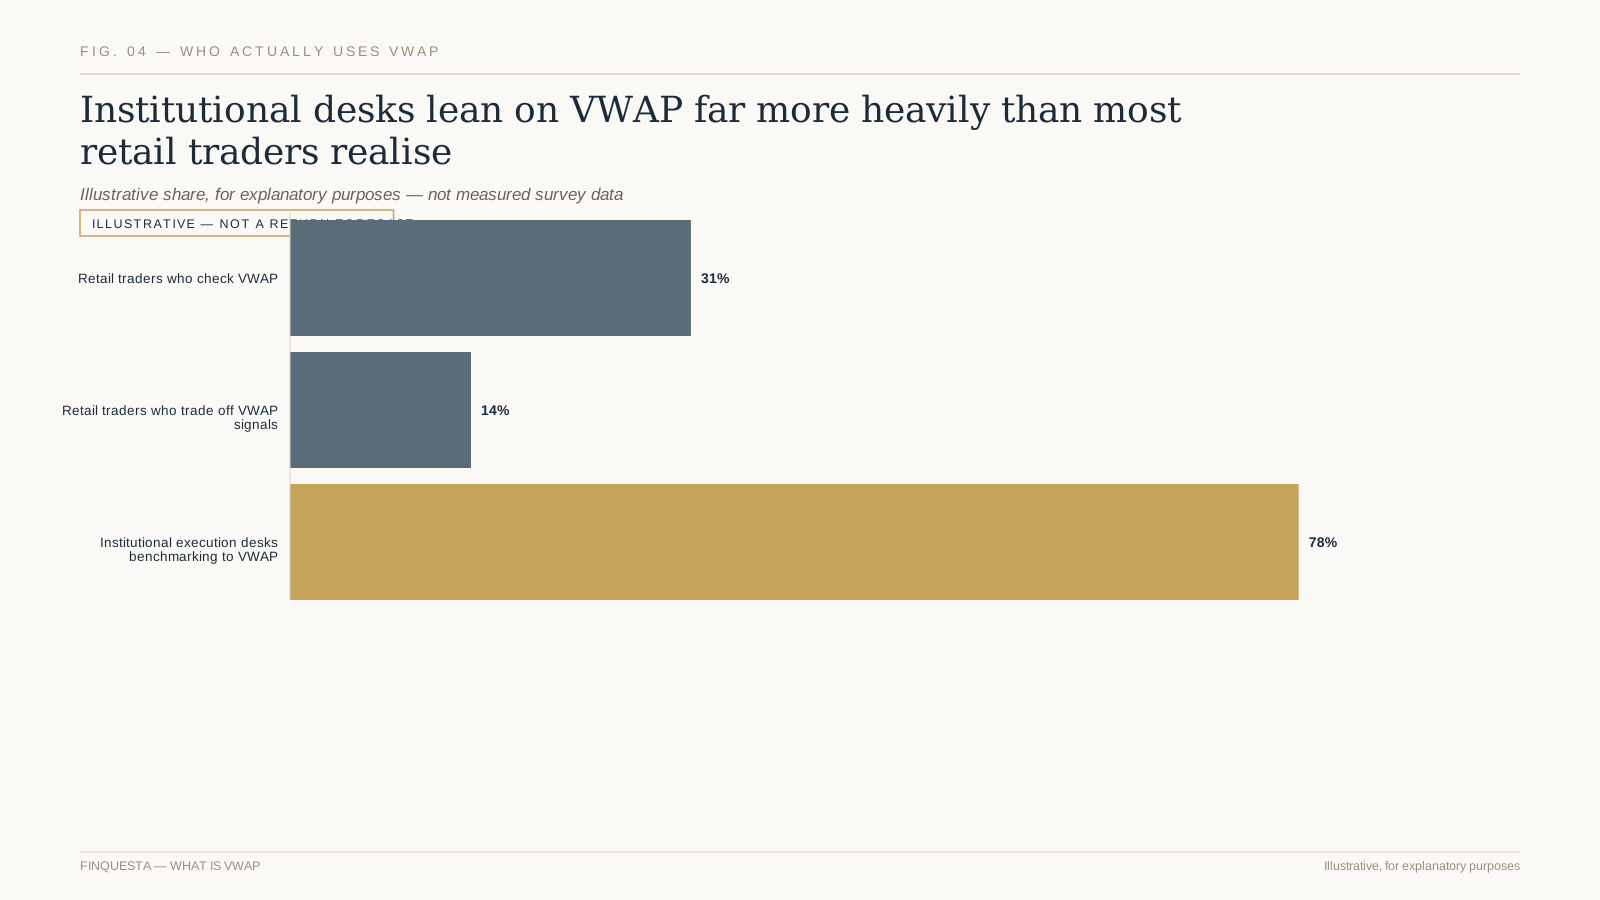
Fig. 02 — Institutional execution desks lean on VWAP as a benchmark far more than retail traders do

A pension fund or mutual fund placing a large order routes it through a “VWAP algorithm” — software that slices the order into smaller pieces and releases them through the day in proportion to expected volume, aiming to land close to the session’s actual VWAP rather than chase price in one block.

Performance review for that trading desk isn’t “did the stock go up” — it’s “did we beat VWAP.” A buy order filled below VWAP, or a sell order filled above it, is booked as good execution regardless of what the stock did afterward. That single distinction — execution quality versus market direction — is the core reason VWAP exists at all.

This is also why VWAP algorithms exist as a distinct order type on execution platforms rather than just a chart overlay — the desk isn’t looking at the line for a signal, it’s using the underlying formula to schedule an order’s release through the day. The chart line most retail traders see is a side effect of a tool built for a completely different job.

VWAP vs. moving averages — not the same tool

Both tools plot as a single line on a chart, which is exactly why beginners lump them together. But a 20-period moving average and VWAP will visibly diverge on any session with an uneven volume distribution — a heavy opening burst followed by a quiet afternoon pulls VWAP toward the morning’s price far more than it pulls a simple moving average.
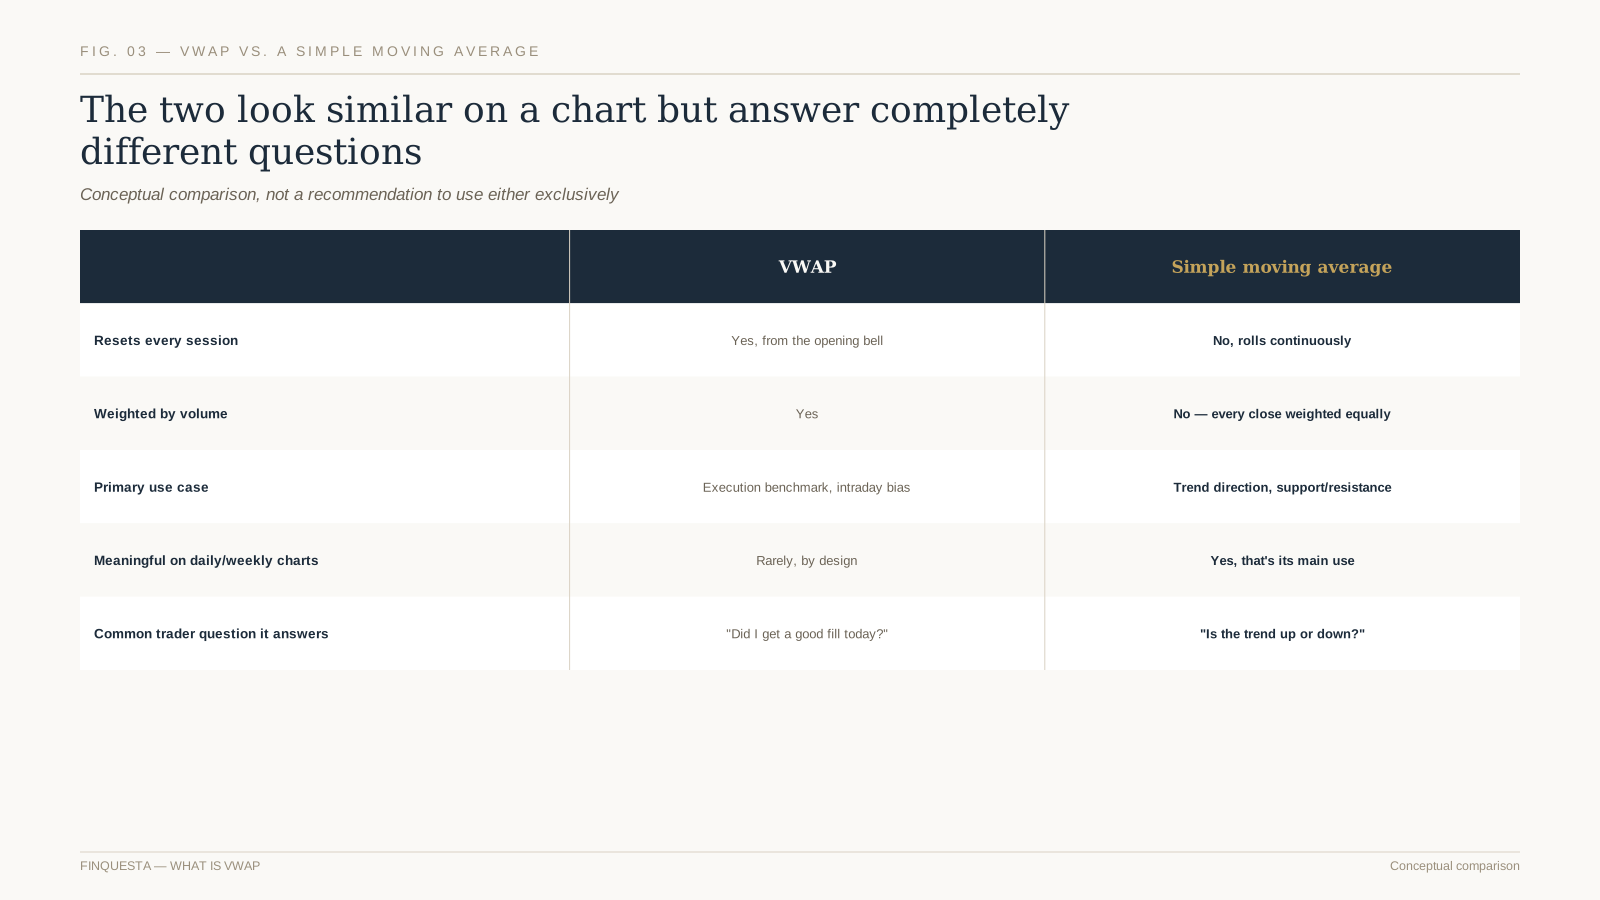
Fig. 03 — VWAP and a simple moving average look alike on a chart but answer different questions

A simple moving average treats every closing price as equally important, regardless of whether ten shares or ten million traded there. It also rolls continuously — today’s 50-day average includes data from over two months ago. VWAP does neither of those things, on purpose.

That difference matters most on low-liquidity stocks, where a moving average can be skewed by a handful of thin trades that VWAP would correctly weight as nearly irrelevant. It’s one reason VWAP is considered a cleaner intraday reference on names with genuine trading volume.

A 50-day or 200-day moving average is a positional trader’s tool, telling you about the medium-term trend. VWAP is a same-day tool, telling you about today’s participation. Using them together, rather than picking one, gives a trader both a medium-term compass and a same-day sense of fair value — two different questions, both worth asking.

Reading price above vs. below VWAP

Distance matters too, not just direction. Price sitting a fraction of a percent above VWAP is a near-neutral reading; price sitting two or three percent above it, especially early in the session, is a materially stronger statement about who’s currently in control of the tape.

The common shorthand — above VWAP is bullish, below is bearish — is a reasonable starting heuristic and a dangerous ending point. It describes where the session’s average buyer or seller currently stands relative to price, not where price is going next.

A stock trading well above VWAP in the first hour, then sliding back toward it by midday, is telling a very different story from one grinding steadily higher above VWAP all session. Reading VWAP in isolation, without the shape of the price path around it, throws away most of the useful information.

A stock that opens above VWAP and never looks back all session is showing sustained buyer conviction, worth reading very differently from one that crosses VWAP six times in an hour, which is telling you the two sides are evenly matched and genuinely undecided — the same “above VWAP” label, two opposite stories.

The Fade Zone — Original Finquesta concept for reading extension

ORIGINAL FINQUESTA CONCEPT — The Fade Zone  names the area where price has stretched far enough above or below VWAP that short-term mean reversion becomes statistically more likely — not certain, but more likely. Traders identify it using VWAP standard-deviation bands rather than a fixed percentage, since a stretch that’s normal for a volatile small-cap is extreme for a stable large-cap.

The mistake beginners make with the Fade Zone is treating it as an automatic reversal signal. It’s better read as a caution flag: price this far from the volume-weighted average has moved further than typical intraday participation would suggest, so a continuation from here needs a genuinely new reason — fresh news, a breakout, a block trade — not just momentum carrying it further on its own.

Think of the Fade Zone as a question, not an answer: “has this move already outrun the volume that would normally support it?” Sometimes the honest response is yes, and a pullback follows. Sometimes fresh volume arrives and justifies the extension entirely — which is exactly why this is a caution flag and not a mechanical trade trigger.

It’s worth separating the Fade Zone from a simple “overbought” reading borrowed from an oscillator like RSI. RSI measures momentum over a fixed lookback regardless of volume; the Fade Zone measures distance from a volume-weighted anchor. The two often agree, but when they disagree, the volume-based read tends to be the more session-specific, more current one.

VWAP standard-deviation bands

The exact multiplier — one, two, or a custom value — is adjustable on most platforms, and there’s no single correct universal setting. A more volatile stock or index like Bank Nifty typically needs wider bands to avoid constant false touches compared to a comparatively steady large-cap.

Most platforms let you plot bands one and two standard deviations above and below the VWAP line itself, functioning similarly in spirit to Bollinger Bands but calculated from the session’s volume-weighted distribution rather than a simple moving average — worth comparing directly if you already use Bollinger-style bands elsewhere.

Price touching the outer band doesn’t mean “sell” any more than touching a Bollinger Band does. It means the stock is trading further from the session’s volume-weighted centre than roughly two-thirds of the day’s activity would predict — useful context, not a standalone signal.

Some traders use the first standard-deviation band as a take-profit reference on mean-reversion trades and the second as a stop-loss reference on trend-continuation trades — two opposite uses of the same bands, which only makes sense once you’re clear on which type of setup you’re actually trading in the moment.

Using VWAP for intraday entries on NSE stocks

Combine the VWAP pullback idea with a higher-timeframe check before entering — a five-minute chart pullback to VWAP inside a stock that’s also respecting its daily trend carries more weight than the identical pullback inside a stock fighting its own daily direction.

A common, disciplined approach: wait for price to pull back toward VWAP after establishing a clear directional bias earlier in the session, then look for a rejection candle or volume pickup at that level before entering in the direction of the existing bias — treating VWAP as dynamic support or resistance rather than a standalone trigger.

This works better on liquid, high-volume NSE names — Nifty 50 constituents and other heavily traded large-caps — where enough real participants are actually watching and reacting to the same VWAP line. On thin, illiquid small-caps, VWAP can be distorted by a single large trade and stops being a reliable crowd-behaviour signal.

The first fifteen to thirty minutes after the open are usually skipped by disciplined VWAP traders entirely — early-session volume is thin relative to the rest of the day, so the VWAP line itself is still unstable and swings more with every print than it will once more volume has accumulated behind it.

VWAP in algorithmic execution: VWAP orders vs. TWAP orders

Retail traders rarely need either order type directly — most retail order sizes are too small to move the market meaningfully in the first place, which is the entire problem these algorithms exist to solve. They’re worth understanding conceptually, less so worth seeking out on a typical retail brokerage account.

A VWAP order type, offered by many institutional and some retail-facing broker platforms, automatically slices a large order across the session weighted toward historically high-volume periods — typically the opening and closing windows — aiming to minimise the order’s own impact on price.

A TWAP order (time-weighted average price) does something simpler: it slices the order into equal pieces released at equal time intervals, ignoring volume patterns entirely. TWAP is more predictable and easier for other participants to detect; VWAP is harder to front-run but assumes the day’s volume pattern behaves normally.

A third, less common order type worth knowing exists — Percentage of Volume (POV) — which paces an order as a fixed proportion of real-time volume rather than a pre-set schedule. It’s more adaptive than either VWAP or TWAP orders but requires live volume data to work, which is why it’s mostly an institutional tool rather than a retail one.

Reading common VWAP relationships at a glance

A quick sanity check before relying on any single reading: pull up the same setup on three or four different stocks the same day. If the VWAP relationship tells a consistent story across a genuinely broad set of names, it’s likely reflecting real market-wide behaviour rather than something specific and noisy to one ticker.

The table below is a memory aid for the readings covered so far, not a set of mechanical rules. The same price-to-VWAP relationship can mean different things depending on the time of day, the surrounding volume, and what the broader market is doing — context this table can’t carry, but the rest of the article can.

Price relationshipLoose readWhat to check before acting
Steady above VWAP all sessionSustained buyer controlVolume profile support beneath current price
Crossing VWAP repeatedlyGenuinely undecided sessionWait for a clearer resolution before entering
Touching outer standard-deviation bandExtended, inside the Fade ZoneFresh volume or news justifying continuation
Pinned tightly to VWAP for an hour+Low conviction, low volatilityConsider sitting out until real direction emerges

Common VWAP mistakes beginners make

Most of these mistakes share a root cause: treating a descriptive, backward-looking average as if it were a predictive, forward-looking signal. VWAP is honest about what already happened and silent about what happens next — the mistakes below are mostly variations on forgetting that distinction mid-session.

  • Comparing today’s VWAP level to yesterday’s, forgetting the Anchor Reset means the two numbers share no real connection.
  • Treating a touch of the VWAP band as an automatic buy or sell signal instead of one input among several.
  • Applying VWAP to illiquid, thinly traded stocks where a single block trade can distort the entire line.
  • Expecting VWAP to work as a swing-trading tool when it was built for single-session use.
  • Ignoring volume context entirely and reading only the line’s slope, which defeats the purpose of a volume-weighted tool.

Does VWAP make sense on weekly or multi-day charts?

Some traders track a rolling anchored VWAP from the first trading day of the month or quarter, purely as a big-picture reference for whether the average participant this period is sitting on a gain or a loss — a genuinely useful sentiment gauge, distinct from both standard session VWAP and a VWMA.

The closest legitimate multi-day cousin is a volume-weighted moving average — sometimes labelled VWMA — which applies the same volume-weighting logic over a rolling window like 20 or 50 days instead of resetting daily. It answers a genuinely different question and is worth treating as its own indicator, not “VWAP but longer.”

Standard VWAP, by construction, is a single-session tool — most platforms simply don’t render a continuous multi-day VWAP line, and the ones that do are quietly recalculating something closer to a volume-weighted moving average, a related but different indicator with its own name for a reason.

If your actual question is about a multi-day or multi-week trend, a proper trend-following or moving-average-based approach answers it more honestly than stretching VWAP outside the single-session job it was designed for.

If you only take one habit from this article, make it this: before treating any VWAP signal as meaningful, glance at total volume for the day so far against its typical average. A VWAP relationship built on unusually light volume is a far weaker signal than the identical relationship built on a genuinely active session.

Combining VWAP with volume profile

Reading the two together also helps separate a genuine breakout from a low-conviction one: price clearing VWAP on a volume-profile chart showing thinning activity above is a weaker breakout than one clearing VWAP into a zone the profile shows as historically well-traded and accepted.

Volume profile shows how much total volume traded at each price level through the session, displayed as a horizontal histogram alongside the price chart. Where VWAP tells you the single average price weighted by volume, volume profile shows you the full distribution — including whether the day was genuinely one-sided or split across two competing price zones.

Used together, a trader can check whether price sitting above VWAP is also sitting inside a high-volume node (real conviction) or in a thin, low-volume air pocket (fragile, likely to snap back) — a level of nuance neither tool provides fully on its own.

The high-volume node closest to current price — often called the point of control on a volume profile — is frequently a better support or resistance reference than VWAP alone during the middle of the session, precisely because it captures where the heaviest real disagreement between buyers and sellers has actually settled.

VWAP’s real limitations

A related, often-missed limitation: VWAP treats a buy and a matching sell at the same price as identical, even though one side was aggressive (crossing the spread to get filled immediately) and the other was passive (waiting for price to come to them). Order-flow tools that separate the two exist, but standard VWAP doesn’t make that distinction at all.

It’s also a purely reactive, backward-looking construction — even a real-time VWAP line is, by definition, built from trades that have already happened. Nothing about the formula anticipates news, and a well-informed trader with a genuine information edge will always beat a VWAP-only approach on the specific days that edge matters most.

VWAP says nothing about why price moved — only where the volume-weighted centre of gravity currently sits. A stock gapping up 8% on genuine, verified news and one gapping up 8% on a rumour both show an identical VWAP relationship in the first few minutes, even though the two situations carry very different risk.

It also degrades meaningfully around scheduled events — earnings releases, index rebalancing days, expiry sessions — when volume patterns break from their normal shape and the running average can lag badly behind a genuinely new price regime forming in real time.

VWAP also says nothing useful in the final minutes of a session when volume typically spikes sharply into the close for reasons unrelated to the day’s trend — index rebalancing flows, closing auctions, and same-day options expiry can all distort the last few minutes of the calculation in ways that don’t reflect genuine sentiment.

Risk management around VWAP-based trades

Decide your maximum number of VWAP-based trades per session before the market opens, not while you’re already in one. A tool that’s genuinely useful in moderation becomes a source of overtrading fast once every minor cross of the line starts to look like a new opportunity worth acting on.

Keep a simple trading journal that notes the VWAP relationship at entry alongside the usual entry price, stop, and target. Over a few months, that single extra column often reveals whether your specific setups actually perform better near VWAP, near the bands, or somewhere else entirely — a personal statistic no general article can hand you.

Treat a VWAP-based entry with the same stop-loss discipline you’d apply to any other setup — VWAP tells you about average positioning, not about how far price can move against you before the setup is simply wrong. A stop placed just beyond the relevant standard-deviation band is a common, sensible anchor point.

Position size around VWAP setups the same way you would any intraday trade: a fixed, small percentage of capital at risk per trade, never scaled up because a setup “feels” more reliable than usual. VWAP improves the quality of your reference point — it does not improve your odds enough to justify abandoning position sizing discipline.

Avoid the trap of moving a stop further away “because VWAP suggests it’ll come back.” VWAP describes an average, not a guarantee, and a losing trade that keeps getting more room based on a reference line is one of the fastest ways a small, planned loss turns into a large, unplanned one.

VWAP for options traders

Near-the-money options on a liquid underlying like Nifty are the exception — their price still tracks the underlying’s movement closely enough that the underlying’s VWAP relationship carries genuine, if partial, relevance to how that specific option is likely to behave over the next few minutes.

Options traders on Nifty and Bank Nifty commonly watch the underlying index’s VWAP rather than any individual option’s price, since option premiums move on a mix of the underlying’s price, time decay, and implied volatility — too many moving parts for VWAP’s single-variable logic to apply cleanly on its own.

A common, simple use: treat the underlying trading above its session VWAP as a mild bias toward call-side setups, and below VWAP as a mild bias toward put-side setups — one input into a broader decision that should also weigh strike selection and time to expiry, covered in more depth in a dedicated look at calls and puts.

This is also a reason VWAP is a weaker reference on far-out-of-the-money options specifically: their price is dominated by implied volatility and time decay, and the underlying’s VWAP relationship explains only a small part of the option’s own price behaviour the further the strike sits from the current market price.

Options sellers, rather than buyers, sometimes use the underlying’s VWAP relationship differently again — as a rough guide for where to place a strike when writing a covered call or a cash-secured put, treating VWAP as a proxy for “fair value today” rather than a directional signal at all.

Backtesting a simple VWAP strategy — what to actually check

Before trusting any VWAP-based rule with real money, backtest it across a range of market conditions — trending days, choppy range-bound days, and high-volatility event days separately — since a rule that performs well only in trending conditions will quietly bleed money the rest of the time.

Check the strategy’s performance across at least 50-100 trades, not five or ten good-looking examples cherry-picked from memory. VWAP setups are popular precisely because they’re easy to eyeball as working in hindsight on a handful of charts — a large enough sample is the only honest test.

Paper-trade any new VWAP-based rule for at least a few weeks before risking real capital on it. The goal of a backtest and a paper-trade run isn’t to find a rule that never loses — no honest rule does that — it’s to know your realistic win rate and average loss size before they’re a surprise.

Keep the backtest window recent and relevant — a rule tuned on data from years ago may no longer match current liquidity conditions, algorithmic participation levels, or the specific stock’s current typical volume, all of which have shifted meaningfully across most markets over the past several years.

A simple VWAP checklist before you trade it

  1. Confirm the stock has genuine daily liquidity — VWAP is far less reliable on thin, illiquid names.
  2. Check whether price is inside or outside the standard-deviation bands, not just above or below the line itself.
  3. Look at the shape of the price path leading into the current VWAP relationship, not just the current snapshot.
  4. Cross-check with volume profile if available, to see whether the current level has real conviction behind it.
  5. Set a stop-loss and position size before entering, exactly as you would for any other setup.

Review your last twenty trades, if you’ve been trading a while, and note where price sat relative to VWAP at your actual entries — not in hindsight, but as you genuinely saw it then. Most traders are surprised by the pattern, one way or the other, once they actually look instead of assume.

None of this makes VWAP a strategy on its own. It’s a reference line — an honest, volume-aware description of where the session’s real trading has actually happened, which is a genuinely useful thing to know and a poor substitute for an actual trading plan built around it.

What Is VWAP: frequently asked questions

What is VWAP in simple terms?

VWAP is the average price a stock has traded at during the current session, weighted by how much volume traded at each price level. It resets every day and is used mainly to judge execution quality, not to predict future price direction. Most traders read it directly off their charting platform rather than calculating it themselves.

Is VWAP a leading or lagging indicator?

Lagging. It’s built entirely from price and volume that have already happened, and it smooths out with more data as the session progresses — which is also why it reacts more slowly than raw price in the first few minutes after the open. Treat it as a description of what already happened, not a forecast.

Can VWAP be used for swing trading?

Standard VWAP resets daily and isn’t designed for multi-day analysis, so it’s a poor fit for swing trading out of the box. Anchored VWAP, manually set to a specific starting point like a breakout day, is the closer tool for a multi-day question, and a volume-weighted moving average is closer still.

What is the difference between VWAP and average price?

A simple average treats every trade equally regardless of size. VWAP weights each price by the volume traded there, so a price with heavy participation counts far more than one with a single small trade — a meaningfully different, more representative number, especially on a day with an uneven volume distribution.

Do beginners really need VWAP?

Not on day one. It’s more useful once you already understand basic price action and volume, since VWAP is a refinement of reading volume-weighted behaviour, not a replacement for understanding what volume itself signals in the first place. Learn to read a simple candlestick chart and volume bars before adding VWAP on top.

Is trading above VWAP always bullish?

No. It’s a reasonable default heuristic for session-wide bias, but the shape of the price path, the standard-deviation bands, and the surrounding volume profile all matter more than the simple above-or-below reading on its own. Treat it as one input, never the whole decision.

What is anchored VWAP?

A version of VWAP manually anchored to a specific event — an earnings date, a breakout, a swing low — instead of the market open. It answers “what’s the volume-weighted average price since this specific moment,” which standard session VWAP cannot, since standard VWAP only ever knows about the current calendar day.

Does VWAP work on Bank Nifty and index options?

Traders typically apply VWAP to the underlying index rather than to individual option contracts, since option premiums are driven by several additional factors — time decay and implied volatility among them — that VWAP’s single-variable logic doesn’t capture. Near-the-money contracts on a liquid underlying are the closest exception.

What is the difference between VWAP and TWAP?

VWAP weights order execution toward historically high-volume periods of the session, typically the open and close. TWAP splits an order into equal pieces at equal time intervals regardless of volume patterns — simpler, more predictable, and easier for others to detect, which is exactly the trade-off a large institutional order has to weigh.

Can retail traders access VWAP order types, or only the chart line?

Most retail brokers show the VWAP chart line by default, but VWAP as an actual order-execution algorithm is typically limited to institutional or high-net-worth trading platforms. For most retail order sizes, the chart line for reference is genuinely all you need — the execution algorithm solves a problem retail order sizes rarely have.

Disclaimer This article is for informational and educational purposes only and does not constitute financial, investment, tax, or legal advice. Figures, rates, and regulations mentioned are subject to change; please verify current details with official sources (RBI, SEBI, the Income Tax Department, IRS, or a licensed financial advisor) before making financial decisions. Finquesta may earn a commission from affiliate links in this article at no extra cost to you.
What Is F&O Trading? Risks & Basics Explained [2026]

f&o trading
WHAT IS F&O TRADING? F&O trading means trading futures and options — derivative contracts on the NSE and BSE whose value is derived from an underlying stock or index rather than the asset itself. A futures contract obligates both the buyer and the seller to transact at a fixed price on a set date. An options contract gives the buyer the right — but not the seller the choice — to do so, in exchange for a premium. Retail traders use F&O to speculate on price moves or to hedge existing positions, through SEBI-registered brokers, under exchange-mandated margin rules.

Nine out of every ten individual traders who trade F&O in India lose money — and most of them know it and trade anyway. That single fact from SEBI’s own research changes how this topic should be explained. Most F&O guides walk through call options and put options and stop there. This one starts with what actually happens to the people who trade them: what it costs, how the 2024–2026 regulatory overhaul changed the game, and why the buyer of a cheap option is often in a worse position than they think, not a better one.

What F&O actually means, before the jargon

Suresh runs a small logistics business and holds Reliance shares he bought five years ago. He’s not selling them, but he’s nervous about a short-term dip before an earnings call. Instead of selling his shares, he buys a put option on Reliance — a contract that lets him sell at a fixed price if the stock falls, for a small, known premium. That’s hedging: using a derivative to offset a risk he already has.

Priya, a college student with a demat account and a trading app, has no Reliance shares at all. She buys the same put option purely because she expects the stock to drop. That’s speculation: using the same instrument to bet on a price move with no underlying position to protect.

Both trades use the identical contract. F&O itself is neutral — it’s a tool. What determines whether it’s a risk-management instrument or a high-speed way to lose money is who’s using it, why, and with how much capital behind them. SEBI’s data, which this guide covers in detail below, suggests the second kind of trader vastly outnumbers the first among individuals.

How futures contracts work

A futures contract is an agreement to buy or sell a fixed quantity of a stock or index at a fixed price on a fixed future date — and unlike options, both sides are obligated to honour it. If you buy (go “long”) one lot of Nifty futures, you’re agreeing to settle at the contract’s price on expiry day, whether the index has risen or fallen in the meantime.

Three mechanics matter more than the definition itself:

  • Margin, not full value. You don’t pay the full contract value upfront — you post a margin (typically a percentage of the contract’s notional value, calculated by the exchange’s SPAN and exposure margin framework) as security. This is what creates leverage: a relatively small deposit controls a much larger position.
  • Mark-to-market (MTM), daily. Futures positions are settled in cash every single trading day, not just at expiry. If the position moves against you, the loss is debited from your account that evening — you feel the pain in real time, not just on the day you close the trade.
  • Both sides must settle. There’s no walking away. If you’re still holding the contract at expiry, cash settlement happens automatically based on the closing price of the underlying — gain or loss, no choice involved.

Index futures in India (Nifty, Bank Nifty, Sensex) are cash-settled; a small list of stock futures settle by physical delivery of shares if held to expiry.

How options contracts work

An option is a right, not an obligation — but only for the buyer. A call option gives the buyer the right to buy the underlying at a fixed price (the strike price) before or at expiry. A put option gives the buyer the right to sell at the strike price. In both cases, the buyer pays a premium upfront for that right, and that premium is the most the buyer can ever lose.

The seller (or “writer”) of the option is on the other side of that right. If the buyer chooses to exercise, the seller is obligated to fulfil the contract — sell the shares (for a call) or buy them (for a put) at the strike price, regardless of how far the market has moved against them. In exchange for taking on that obligation, the seller collects the premium immediately, whether or not the buyer ever exercises.

Indian index options (Nifty, Bank Nifty, Sensex) are European-style, meaning they can only be exercised on the expiry date itself, not any time before it — unlike some stock options internationally.

The Premium Illusion — why “low cost” doesn’t mean low risk

Original Finquesta concept: The Premium Illusion

A retail trader who buys an option for ₹1,500 often reasons: “my downside is capped at ₹1,500, so this is a low-risk trade.” Technically true — the loss is capped. But that framing hides the real problem: it isn’t the size of the loss that sinks most option buyers, it’s the probability and pace of losing it.

An option’s premium erodes with every day that passes if the underlying doesn’t move in the buyer’s favour — a mechanical effect known as time decay. Near expiry, that erosion accelerates sharply. A trader can be directionally right about a stock and still lose the entire premium because the move happened a day too late or wasn’t large enough to outrun decay. This is a structural feature of how options are priced, not a flaw specific to any strategy.

This is one reason SEBI’s data (covered in Figure 1 below) shows option sellers and institutional, algorithm-driven traders were consistently more profitable than individual option buyers over FY22–FY24: the seller collects the decay that works against the buyer, trade after trade, while carrying the larger — if statistically less frequent — tail risk. Low upfront cost is not the same thing as a favourable trade.

Margin, leverage, and why F&O eats capital fast

Leverage is F&O’s main appeal and its main hazard, and the two aren’t separable. Because you post margin instead of full contract value, a relatively modest account can control a large notional position — which means gains are amplified, but so are losses, on the same capital base.

Illustrative example (not a return forecast): if a trader posts ₹1 lakh in margin to control a futures position worth ₹10 lakh, a 2% adverse move in the underlying — an ordinary daily swing on a volatile day — produces a ₹20,000 loss: 20% of the margin capital, wiped out by a 2% market move. ILLUSTRATIVE — NOT A RETURN FORECAST; actual margin requirements vary by contract, volatility and exchange rules.

Since November 2024, SEBI has specifically added an Extreme Loss Margin (ELM) surcharge on index derivative positions on their expiry day, on top of the standard SPAN and exposure margin, precisely because expiry-day volatility has historically produced the sharpest, fastest retail losses. Margin isn’t a formality — it’s the exchange’s own acknowledgment of how fast F&O positions can move against a trader.

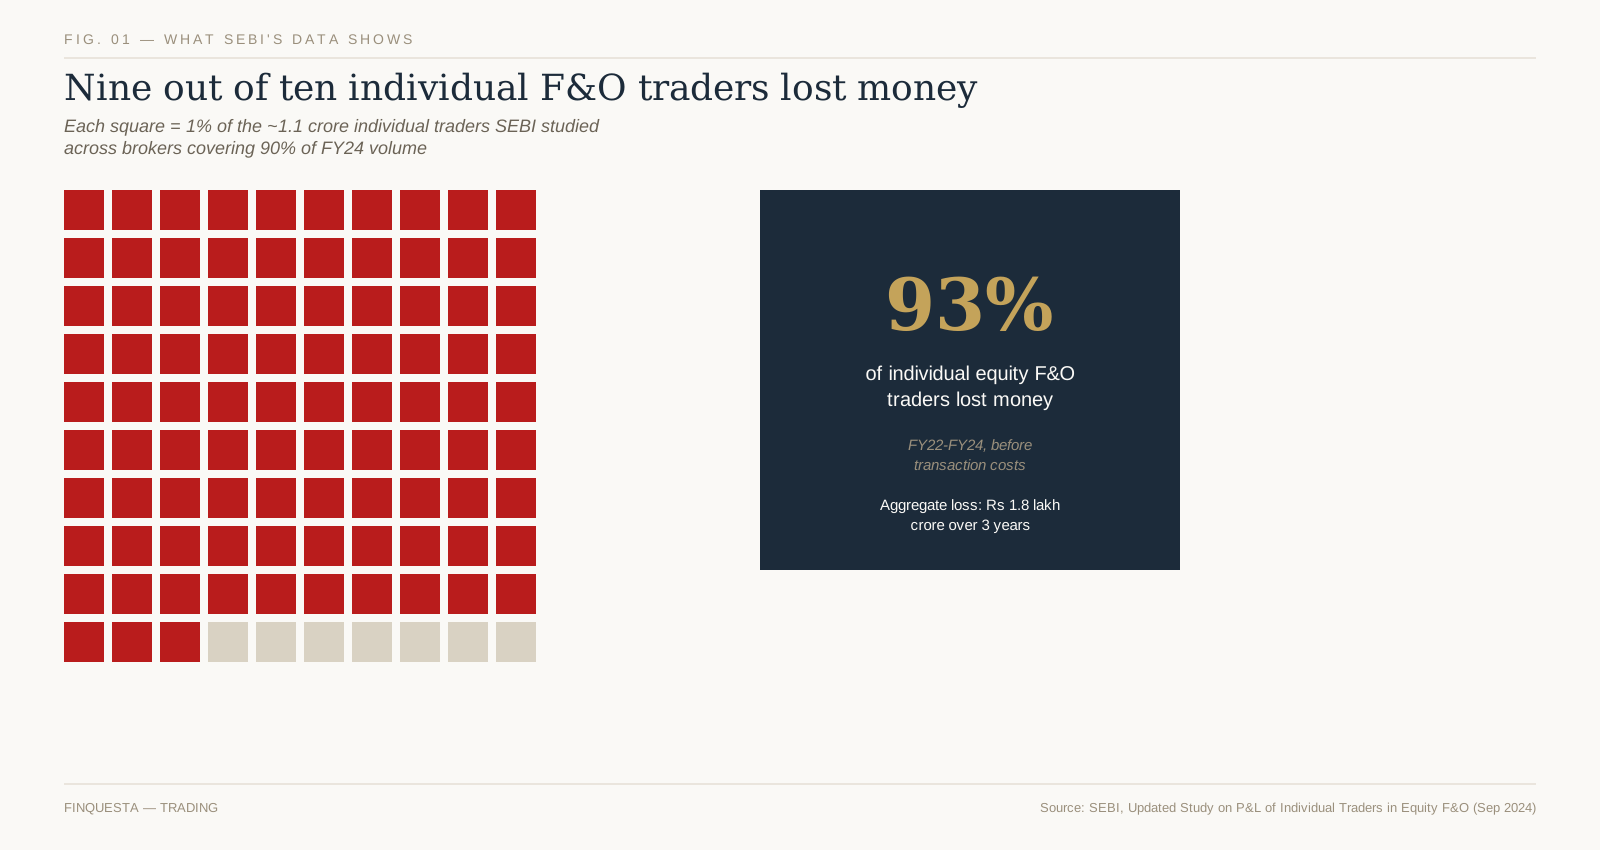
FIG. 01 — 93% of individual equity F&O traders lost money in FY22–FY24, per SEBI’s own study. Source: SEBI, Updated Study on P&L of Individual Traders in Equity F&O (September 2024).

What SEBI’s data actually shows about F&O trading in India

This is the section most F&O explainers skip, and it’s the most important one. SEBI has run two major studies on individual trader outcomes in the equity F&O segment: one published in January 2023 covering FY22, and an updated study in September 2024 covering FY22 through FY24, drawing on data from 15 brokers representing roughly 90% of individual trading volume.

The January 2023 study found that 89% of individual F&O traders lost money in FY22. The September 2024 update found the picture had not improved: 93% of over 1 crore individual traders incurred average losses of about ₹2 lakh each over the three-year period, inclusive of transaction costs. The top 3.5% of loss-makers — roughly 4 lakh traders — lost an average of ₹28 lakh each over the same period. Aggregate losses for individual traders exceeded ₹1.8 lakh crore across the three years [source: SEBI, Updated Study on P&L of Individual Traders in Equity F&O, September 2024].

In sharp contrast, proprietary trading desks and foreign portfolio investors (FPIs) — categories dominated by institutional, algorithm-driven trading — booked gross trading profits of roughly ₹33,000 crore and ₹28,000 crore respectively in FY24 alone, with SEBI noting that the large majority of that profit (96–97%) came specifically from algorithmic execution, not discretionary trading [source: SEBI, Updated Study on P&L of Individual Traders in Equity F&O, September 2024]. The study also found that more than 75% of loss-making individual traders kept trading in F&O despite consecutive years of losses, and that over 75% of individual F&O traders in FY24 had declared annual income under ₹5 lakh.

None of this means F&O trading is impossible to do well — institutions clearly can and do. It means the odds, structurally, favour participants with better data, execution speed and risk systems than most individual retail accounts have access to. That’s a starting fact, not a scare tactic, and it should shape how much capital and confidence any beginner brings to their first trade.

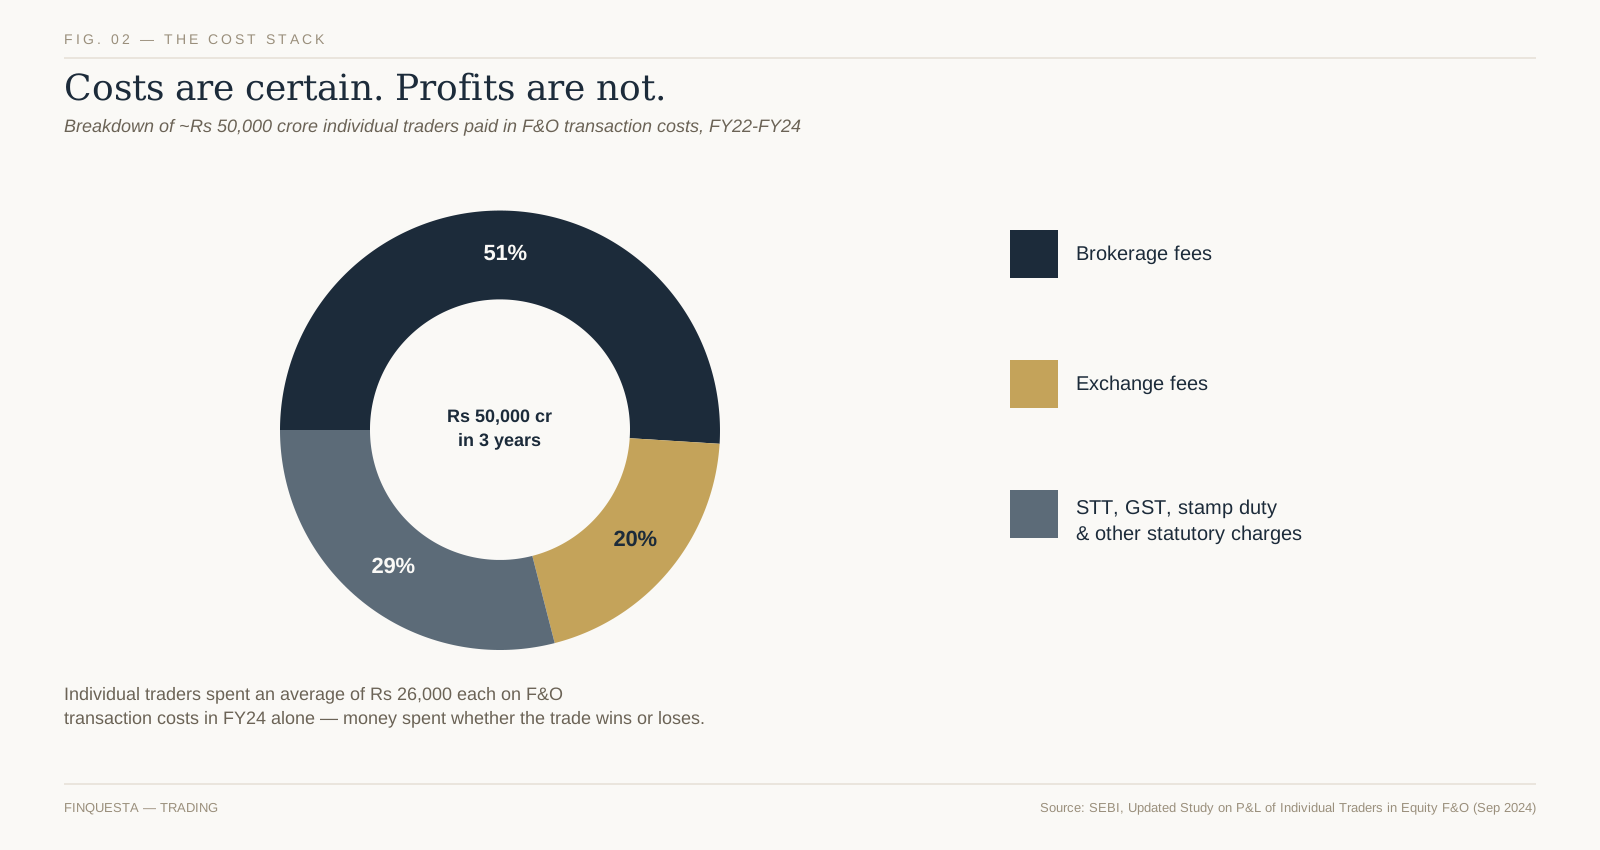
FIG. 02 — Where roughly ₹50,000 crore in individual F&O transaction costs went, FY22–FY24. Source: SEBI, Updated Study on P&L of Individual Traders in Equity F&O (September 2024).

Costs that quietly erode returns

Even a trader who breaks even on price movement can still lose money to costs, because F&O trading involves several charges that apply regardless of outcome. Understanding the full stack matters more here than in long-term investing, because F&O’s shorter holding periods mean costs are paid far more frequently relative to capital deployed.

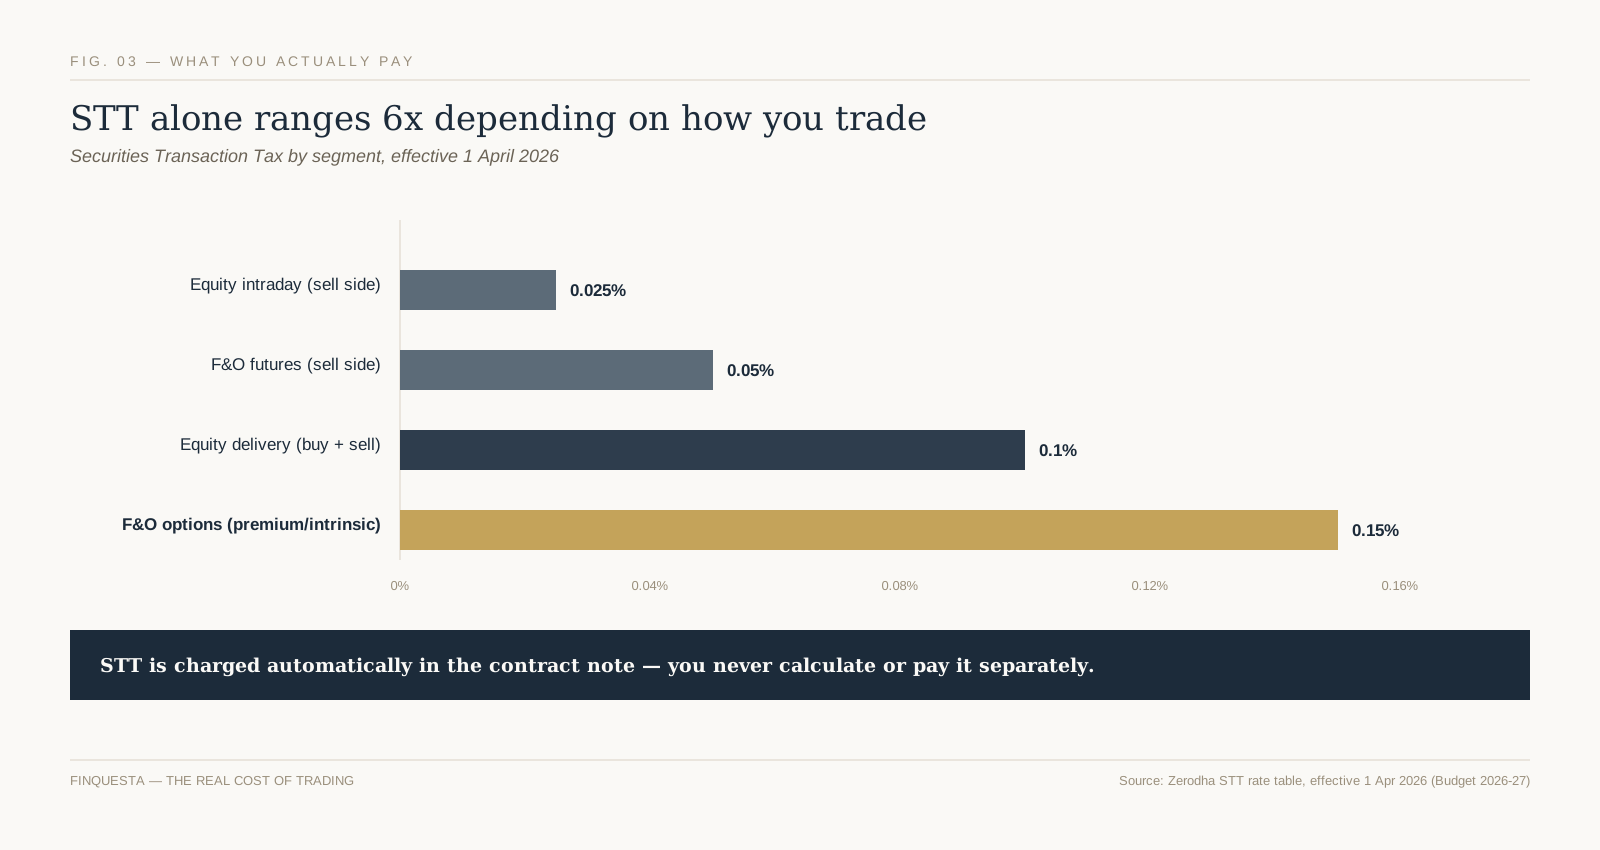
  • Securities Transaction Tax (STT): a direct tax on the sale side of every F&O trade. As per the Union Budget 2026 and effective April 1, 2026, STT on futures is 0.05% of the traded contract value, and STT on options is 0.15% of the premium (and 0.15% on exercise) — both up from the previous rates set in October 2024.
  • Brokerage: a flat or percentage fee charged by your broker per executed order, which was the single largest cost component in SEBI’s FY22–FY24 data at roughly 51% of total individual trader transaction costs.
  • Exchange transaction charges: fees levied by NSE/BSE on every trade, around 20% of the total cost stack per SEBI’s data.
  • GST, SEBI turnover fees and stamp duty: smaller statutory charges applied on top of brokerage and transaction charges, making up the remainder.

SEBI’s study found individual traders spent an average of ₹26,000 each on F&O transaction costs in FY24 alone — money paid out regardless of whether the underlying trade won or lost. Over three years, that added up to roughly ₹50,000 crore across all individual traders combined. A brokerage cost calculator can help you see this stack applied to your own trade size before you place an order.

FIG. 03 — Key SEBI/exchange F&O reforms, 2023–2026. Dates and details need confirmation against the original circulars before publishing; see Fact-Check List.

The Contract-Size Squeeze — what the 2024–2026 reforms actually changed

Original Finquesta concept: The Contract-Size Squeeze

Following its loss-rate findings, SEBI introduced a series of reforms through 2024 and 2025 specifically aimed at reducing speculative, low-probability trading by individual participants, and the Union Budget 2026 added a further cost-side change on top. Taken together :

  • Contract value raised: the minimum value of a new index derivative contract was raised from roughly ₹5–10 lakh to a ₹15–20 lakh band — the first such revision in nine years — which pushed lot sizes higher (for example, Nifty’s lot size rose from 25 to 75 units in the November–December 2024 transition).
  • Weekly expiries rationalised: exchanges were limited to offering weekly expiry contracts on only one benchmark index each, ending the previous situation where several indices expired on different days of the same week.
  • Extra margin near expiry: an additional Extreme Loss Margin now applies to index derivative positions on their expiry day, when historical volatility — and retail losses — have been highest.
  • Upfront premium collection and tighter position monitoring: option buyers must pay their full premium upfront (removing a leverage loophole), and exchanges now monitor position limits intraday rather than only at day’s end, phased in through April 2025.
  • STT increase: effective April 1, 2026, the Union Budget raised STT on futures and options, adding a further cost-side deterrent on top of the volume-side changes above.

The name for this pattern — The Contract-Size Squeeze — describes what these changes mean in practice for a retail account with a fixed amount of capital: instead of spreading that capital across several smaller positions, a trader is now pushed toward fewer, larger, more concentrated ones simply to meet the new minimum contract values. The stated intent was to raise the bar to trading altogether; one side effect is that the trades an under-capitalised account can still afford are now bigger relative to that account, not smaller — which is worth understanding before assuming “SEBI made it safer” means “my trade is now lower-risk.” Read our full breakdown of how SEBI’s margin framework applies contract-by-contract.

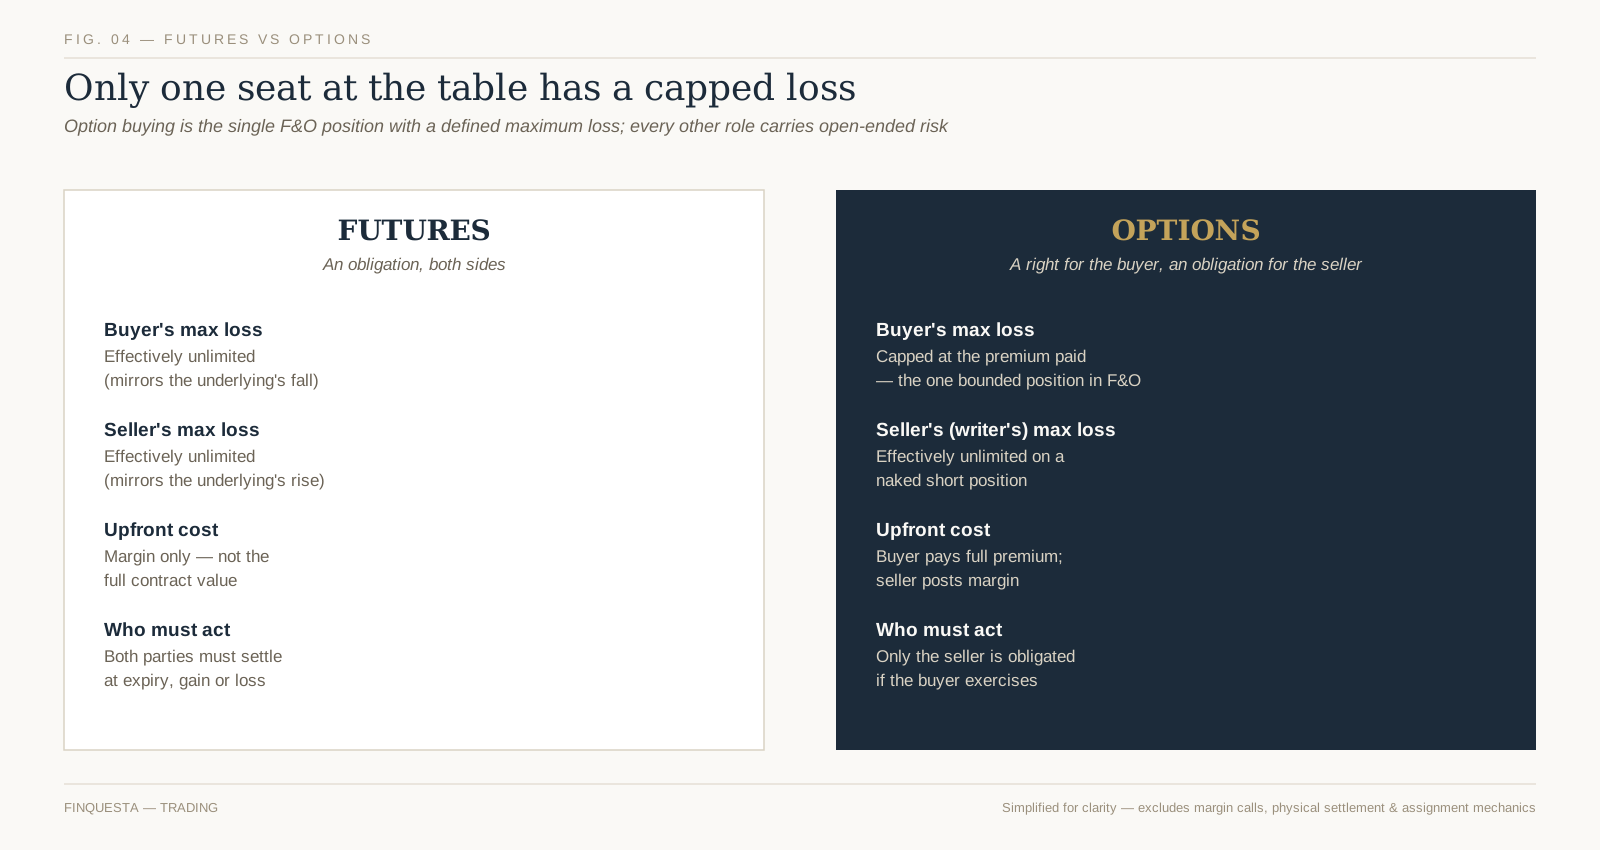
FIG. 04 — Simplified comparison of maximum loss by position type. Excludes margin calls, physical settlement and assignment mechanics.

Futures vs options — how the risk profile really differs

The two instruments are often bundled together as “F&O,” but they carry meaningfully different risk shapes, and the difference matters more than most beginner guides let on.

A futures position — long or short — has, in practical terms, open-ended risk in both directions: a buyer’s loss grows as the underlying falls, a seller’s loss grows as it rises, and neither side has a built-in cap. An options buyer is the one position in the entire F&O universe with a genuinely bounded maximum loss: the premium paid, and nothing more, because the buyer can simply choose not to exercise a contract that has moved against them. An options seller, by contrast, takes on the mirror image — collecting a limited, known premium in exchange for open-ended obligation risk if the position moves sharply against them, particularly on uncovered (“naked”) positions.

This is why “I’m just buying an option, so my risk is limited” is true in isolation but incomplete in practice — the Premium Illusion covered earlier explains why a capped-but-likely loss can still be a poor trade, and why a trader who moves from buying options to selling them is taking on a materially different, larger-tailed risk, even though the premium collected looks like “free money” upfront.

Common F&O strategies beginners hear about

Beyond outright buying or selling a single contract, traders combine futures and options into structured positions. These are explained here for what they mechanically are, not as a recommendation to use any of them — each carries its own risk profile, cost structure and margin requirement, and suitability depends entirely on an individual’s capital, risk tolerance and market view.

  • Covered call: an investor who already holds the underlying shares sells a call option against them, collecting the premium as extra income, in exchange for capping their potential upside if the stock rallies past the strike.
  • Protective put: an investor holding shares buys a put option as insurance against a decline — similar in spirit to Suresh’s hedge earlier in this guide — paying a premium for downside protection.
  • Spreads (e.g., bull call spread, bear put spread): buying one option and simultaneously selling another at a different strike, which typically reduces both the cost of the position and its maximum profit potential, while also capping the maximum loss compared to an outright naked position.

Every one of these still carries the underlying dynamics covered above — margin, time decay, and transaction costs on each leg of the trade. A three-leg spread pays transaction costs three times over, which is worth factoring in before assuming a “hedged” strategy is automatically a low-cost one.

Taxation of F&O trading in India

Under Indian income tax law, profit or loss from F&O trading is treated as non-speculative business income, not capital gains — a distinction that surprises many beginners who assume it would be taxed like equity delivery trades. This means F&O income is added to your other income and taxed at your applicable income tax slab rate, and it must be reported using ITR-3, not the simpler ITR-1 or ITR-2 forms used for salary or capital-gains-only filers.

Turnover for F&O trading, for tax purposes, is calculated as the absolute sum of all profits and losses across trades — not net profit — which means a trader with many small wins and losses can cross a tax-audit turnover threshold even with a modest net result. Whether a tax audit is required depends on this computed turnover relative to limits set under the Income Tax Act, which are periodically revised.

This section is general information, not tax advice specific to your situation — F&O tax treatment has enough moving parts (turnover computation, audit thresholds, presumptive taxation eligibility) that a chartered accountant familiar with trading income is worth consulting before filing, especially in your first year of F&O activity.

Who should — and shouldn’t — trade F&O

This isn’t a recommendation either way; it’s a framework for the questions worth asking honestly before your first trade.

  • Capital you can lose without consequence: given SEBI’s data on how often individual traders lose, and given the raised contract-value minimums since 2024, F&O now requires meaningfully more capital per position than it did two years ago. Money needed for near-term expenses or emergencies doesn’t belong here.
  • A specific view or a specific risk to hedge: the clearest, most defensible use cases in SEBI’s own framing are hedging an existing position (like Suresh) or acting on a well-researched, time-bound view — not habitual, undirected trading.
  • Willingness to track a position daily: unlike a long-term equity or mutual fund holding, an open F&O position — especially near expiry — can require active daily attention because of mark-to-market settlement and time decay.
  • Honest accounting for costs, not just price moves: as Figure 2 shows, costs are certain and payable regardless of outcome. A trading plan that only models price direction, and ignores STT, brokerage and exchange charges, is modelling an incomplete picture.

If most of these don’t clearly apply to you yet, that’s useful information, not a verdict — building market experience through smaller, longer-horizon instruments first is a legitimate path toward F&O, not a consolation prize.

Before you place your first F&O trade

  • Read your broker’s risk disclosure document in full — SEBI requires brokers to provide this before enabling F&O trading on your account, and it’s written specifically to cover the mechanics this guide has walked through.
  • Calculate your actual margin requirement and worst-case loss for the specific contract and lot size you’re considering, using your broker’s margin calculator — not a rough estimate.
  • Total the full cost stack — STT, brokerage, exchange charges, GST — for your position size before placing the trade, not after.
  • Decide your exit plan (both profit-taking and loss-limiting) before you enter the trade, not while you’re watching the position move.
  • Start with position sizes small enough that the raised, post-2024 lot sizes don’t push you into a single trade that represents an outsized share of your total trading capital.

Frequently asked questions

What is F&O trading in simple terms?

F&O trading means buying and selling futures and options contracts — agreements whose value is based on an underlying stock or index. A futures contract obligates both sides to transact at a set price on a set date; an options contract gives the buyer the right, but not the obligation, to do so, for a premium paid to the seller.

Is F&O trading safe?

F&O trading carries substantially higher risk than long-term equity or mutual fund investing, largely because of leverage, time decay on options, and short holding periods. SEBI’s own study found 93% of individual F&O traders lost money over FY22–FY24. It isn’t inherently “unsafe” as a tool — institutions use it for hedging every day — but for most individual retail traders, the historical outcomes have skewed heavily toward losses.

Can I lose more than my capital in F&O trading?

It depends on the position. An options buyer’s maximum loss is capped at the premium paid — they cannot lose more than that. A futures position (long or short) or an options-selling position, however, carries open-ended risk that can, in volatile conditions, exceed the margin initially posted, potentially triggering a margin call for additional funds.

What is the difference between futures and options?

A futures contract is a mutual obligation — both the buyer and seller must transact at the agreed price on the expiry date. An options contract gives only the buyer a right, which they can choose not to exercise, while the seller remains obligated if the buyer does exercise. This is why futures carry open-ended risk on both sides, while an options buyer’s risk is capped at the premium paid.

Futures vs options — which is riskier?

It depends on which side of the trade you’re on. Buying an option is the one F&O position with a defined maximum loss (the premium). Selling an option, or taking either side of a futures contract, carries open-ended risk. So “futures vs options” isn’t a single riskier-or-safer comparison — it’s really four distinct risk profiles: futures buyer, futures seller, options buyer, and options seller.

How much capital do I need to start F&O trading?

This depends on the specific contract, its current lot size, and the prevailing margin requirement, all of which change periodically — index contract minimum values were raised to a ₹15–20 lakh band from November 2024, pushing typical lot sizes and margin requirements higher than they were previously.

Is F&O trading considered gambling?

Legally and structurally, no — F&O contracts are regulated financial derivatives with legitimate hedging uses, unlike gambling. Behaviourally, SEBI’s own data raises the concern directly: the regulator found that over 75% of individual traders who lost money in F&O kept trading despite consecutive years of losses, a pattern that overlaps with how compulsive, high-frequency betting behaviour is often described, even though the underlying instrument is a legitimate one.

How is F&O trading taxed in India?

F&O profit or loss is treated as non-speculative business income under Indian tax law, added to your other income and taxed at your income tax slab rate, and reported via ITR-3. Turnover for audit purposes is calculated as the absolute sum of profits and losses across trades, not the net result.

Disclaimer This article is for informational and educational purposes only and does not constitute financial, investment, tax, or legal advice. Figures, rates, and regulations mentioned are subject to change; please verify current details with official sources (RBI, SEBI, the Income Tax Department, IRS, or a licensed financial advisor) before making financial decisions. Finquesta may earn a commission from affiliate links in this article at no extra cost to you.
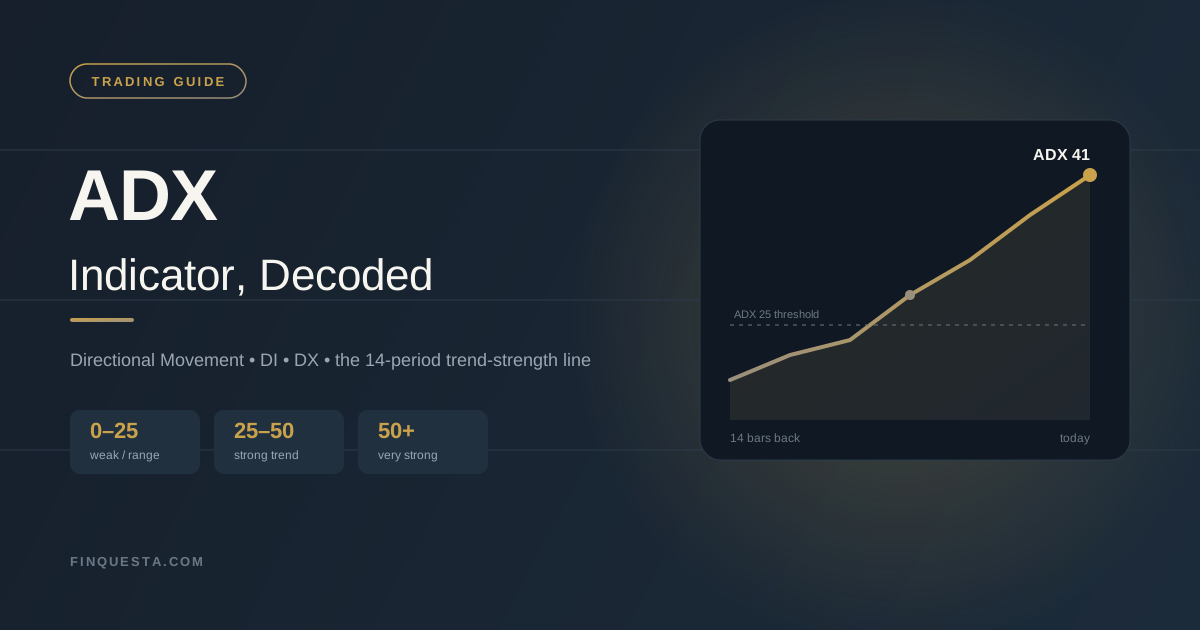
ADX Indicator Explained: Complete Trading Guide (2026)

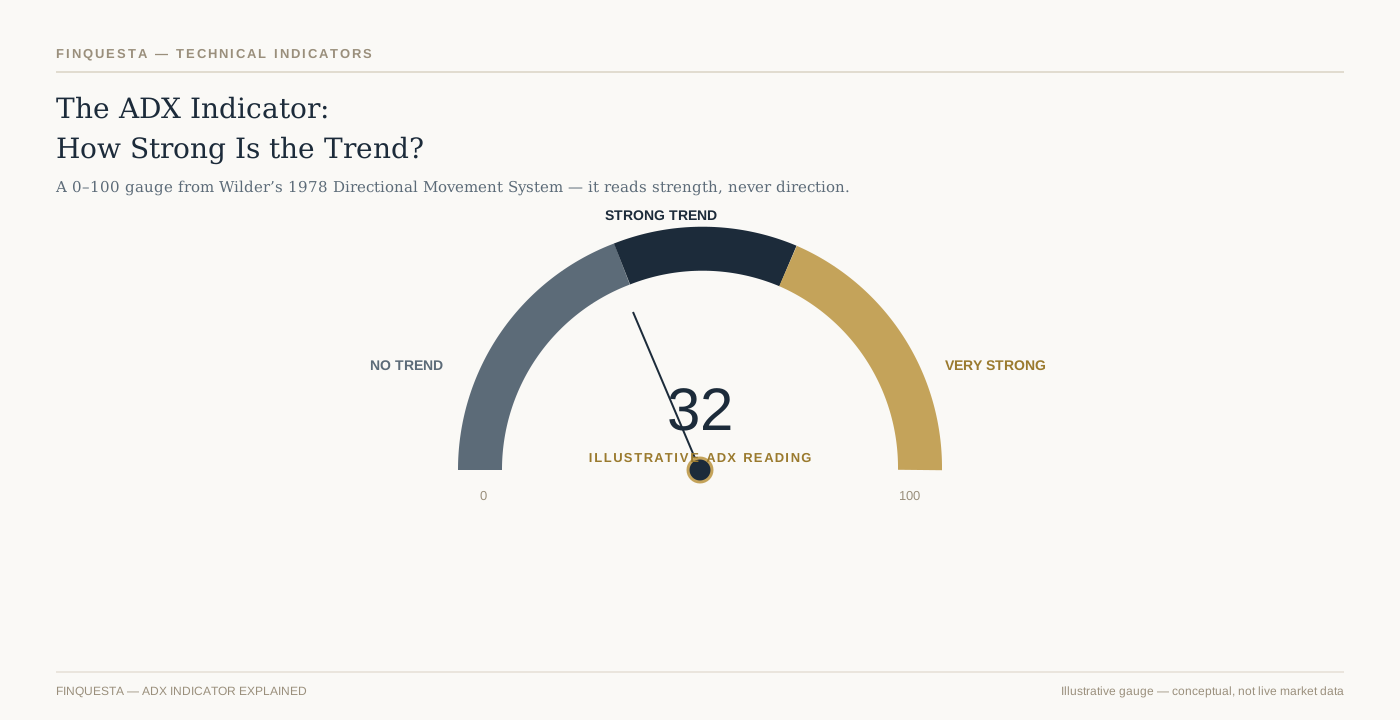
ADX indicator gauge showing the 0–100 trend-strength scale with no-trend, strong-trend, and very-strong zones

Aakash watched the ADX on his Bank Nifty chart cross above 25 and bought call options within the minute — a strong trend, he figured, was a strong trend. Twenty minutes later he was stopped out, because the ADX had never once told him which way that trend was pointing. That mix-up — mistaking strength for direction — is one of the most common, costly misreadings in technical analysis, and untangling it is the whole point of this guide.

The ADX indicator in one picture: a 0–100 gauge that reads how strong a trend is, never which way it points.

What Is the ADX Indicator?

WHAT IS THE ADX INDICATOR? The Average Directional Index, or ADX indicator, is a technical analysis tool that measures how strong a price trend is, on a scale of 0 to 100. It was developed by J. Welles Wilder Jr. and published in 1978. Traders across stocks, forex, commodities, and index derivatives use it to judge whether a market is trending or moving sideways, typically over a 14-period lookback. On its own, the ADX indicator says nothing about direction — a rising line only confirms that a move, up or down, has real conviction behind it.

The ADX indicator never travels alone. It’s the headline output of a three-line system Wilder called the Directional Movement System, which also includes a Plus Directional Indicator (+DI) and a Minus Directional Indicator (−DI). Those two lines carry the direction; the ADX line carries the conviction. Most charting platforms plot all three together in a separate pane below the price chart.

That separation is exactly what tripped Aakash up. He read “ADX above 25” as “get in,” when the honest translation is closer to “something real is happening — go check the DI lines before you decide what it is.” A trending market and a tradeable market aren’t automatically the same thing, and the rest of this guide is about learning to tell them apart.

Who Created the ADX Indicator, and Why a 1978 Book Still Runs on Every Terminal

J. Welles Wilder Jr. trained as a mechanical engineer at North Carolina State University, then spent years in real estate development before his business partners bought him out in 1972. Public biographical records place his birth on 11 June 1935 in Norris, Tennessee, and his later home in Greensboro, North Carolina. He turned that 1972 buyout into trading capital and a new obsession: could market behaviour be reduced to the same kind of measurable, testable rules an engineer would use on a bridge?

The answer, published in 1978 as a slim, spiral-bound volume called New Concepts in Technical Trading Systems, introduced the Relative Strength Index, Average True Range, Parabolic SAR, and the Directional Movement System that produces the ADX indicator — all in the same book, all worked out by hand with a calculator before spreadsheets existed. Wilder self-published it through his own company, Trend Research, in Greensboro. Four indicators out of one self-published book is not a common batting average in this field.

What’s easy to miss almost fifty years later is how mechanical Wilder’s approach really was. He wasn’t trying to describe markets poetically — he was trying to build a rules-based system an engineer could run without emotion getting in the way, and the ADX indicator was his answer to a specific, narrow question: is there enough directional conviction here to justify following a trend at all. Every major charting platform still ships it as a standard tool, essentially unchanged, because that narrow question never stopped being useful.

The Three Lines Inside the ADX Indicator: ADX, +DI, and −DI

Open the ADX indicator on any charting platform and you’ll typically see three lines sharing one pane beneath the price chart, not one. Untangling what each line is actually doing is the single biggest unlock for using this tool correctly.

The +DI line measures upward directional pressure — how much of recent price movement has come from higher highs. The −DI line does the same job for downward pressure, tracking lower lows. When +DI sits above −DI, buyers have the upper hand; when −DI sits on top, sellers do.

The ADX line is different in kind, not just in colour. It’s built from the gap between +DI and −DI, smoothed over time, so it never tells you who’s winning — only how decisively one side is winning. A market can have +DI comfortably above −DI (a clear uptrend) while ADX sits at 15, because the margin between the two lines is still thin and unconvincing.

Think of +DI and −DI as two boxers scoring points, and ADX as the judge’s read on how one-sided the fight has become. The scorecard (DI) tells you who’s ahead. The one-sidedness reading (ADX) tells you whether it’s worth staying to watch the rest of the fight.

How the ADX Indicator Is Calculated, Step by Step

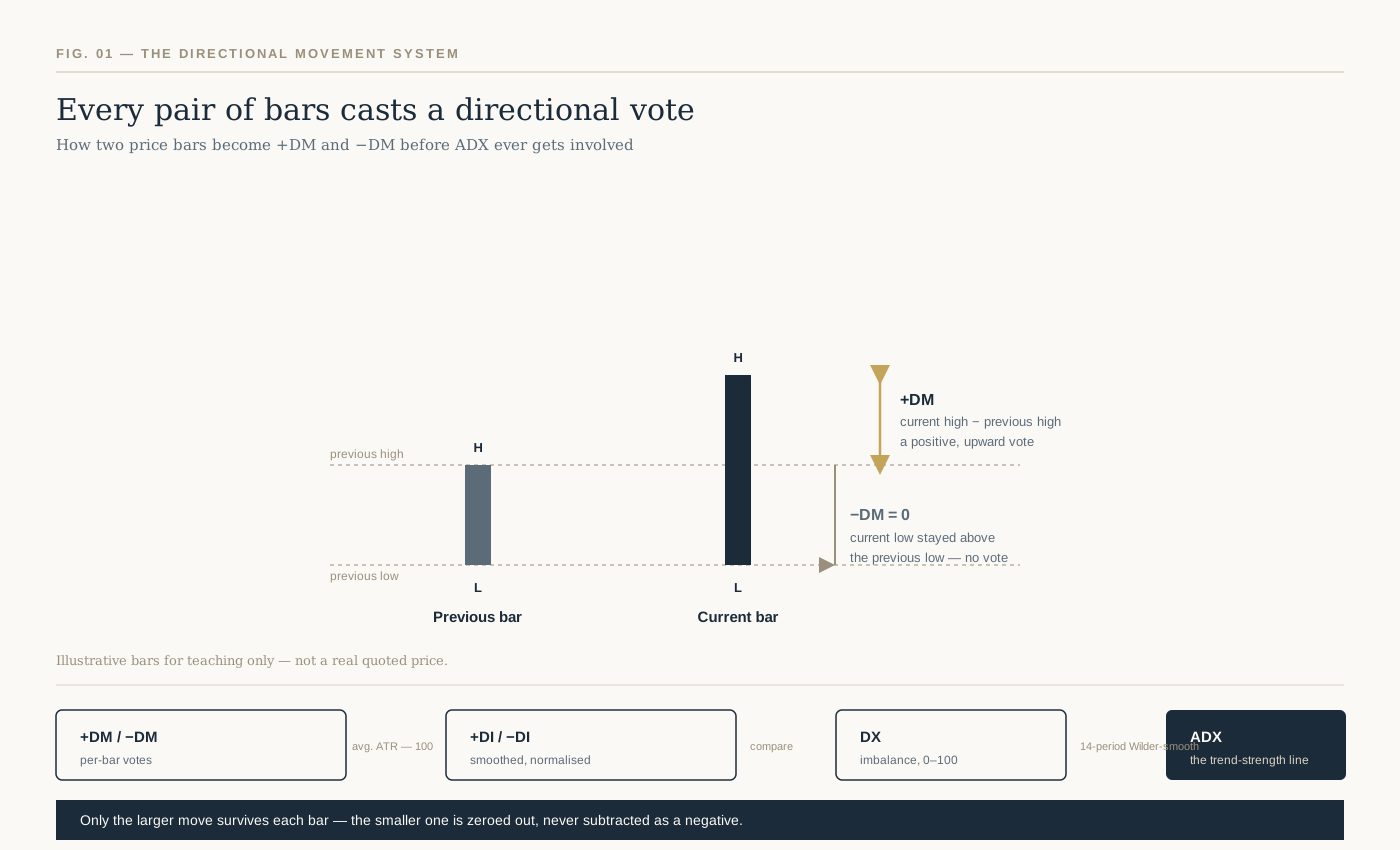
Fig. 1 — Every bar casts a directional vote: only the larger of the two competing moves survives each period.

The formula looks intimidating written out in full, but the underlying logic is simple enough to hold in your head: only the bigger of two competing price moves counts each period, and everything downstream is that idea, smoothed.

Start with two consecutive price bars. UpMove is today’s high minus yesterday’s high. DownMove is yesterday’s low minus today’s low. Whichever one is bigger — and positive — becomes that period’s Directional Movement; the smaller one is zeroed out entirely, not recorded as a negative number.

Whichever move is larger between the two — and only if it’s actually positive — becomes that bar’s directional movement. When the up-move wins and is positive, +DM takes its value and −DM drops to zero for that bar; when the down-move wins instead, the roles simply flip. A bar can register a +DM or a −DM, but structurally never both — every bar casts exactly one directional vote, or none at all.

From there, +DM and −DM get divided by the Average True Range and multiplied by 100, turning raw price gaps into the normalised +DI and −DI percentages. The DX value is the absolute difference between +DI and −DI, expressed as a percentage of their sum — a single number capturing how lopsided that gap is on any given day. ADX is simply DX, smoothed using Wilder’s own averaging method over the chosen period, traditionally 14.

That smoothing step matters more than it looks like it should, and it’s the subject of a later section — because it’s also the most commonly skipped detail in every ADX explainer you’ll find.

A Worked Example: Calculating +DI, −DI, and DX by Hand

Most ADX indicator explainers show the formula and stop there. Watching it run on real numbers, even over a short illustrative stretch, makes the mechanism concrete in a way the formula alone doesn’t.

DayHighLowClose+DM−DMTR
1101.098.5100.0
2102.599.5102.01.503.0
3103.0100.5101.50.502.5
4102.099.099.501.53.0
5104.5101.0104.02.505.0
6106.0103.0105.51.503.0

Table 1 — Six illustrative sessions used to walk through the +DM / −DM / TR calculation by hand.

Five illustrative sessions, tracked day by day: Day 2 makes a higher high than Day 1, so +DM = 1.5 and −DM = 0 for that day. Day 4 breaks the pattern with a lower high and a lower low than Day 3, so that day −DM = 1.5 and +DM = 0. Every other day in this stretch registers an up-vote, the same one-sided pattern Figure 1 walked through earlier.

Summing the five days: total +DM comes to 6.0, total −DM to 1.5, and total True Range to 16.5. Dividing each directional sum by the True Range sum and multiplying by 100 gives +DI = 36.4 and −DI = 9.1 — this stretch leaned firmly upward. Plugging those into the DX formula, 100 × |36.4 − 9.1| ÷ (36.4 + 9.1), returns a DX of 60.0 for this window.

That DX of 60 describes only these five sessions — it isn’t a finished ADX reading. A real ADX needs a full 14-period run of DX values, smoothed Wilder’s way, before it becomes a usable number, and the Warm-Up Window covered next still applies on top of that. This is exactly why virtually every trader lets software run the calculation rather than doing it by hand daily, but knowing what’s happening underneath the line is what lets you trust, or question, what your charting platform shows you.

The Warm-Up Window: An Original Finquesta Concept on Why Fresh ADX Readings Mislead You

Here’s what almost nobody mentions when they teach the ADX indicator: the number on your screen might not be trustworthy yet, even if the maths is correct.

Wilder’s smoothing technique doesn’t behave like a simple moving average, where old data drops out cleanly after a fixed number of periods. Instead it decays gradually, giving old values a shrinking but never-quite-zero weight forever. Because ADX applies this smoothing twice — once to build +DI and −DI, and again to smooth DX into ADX — StockCharts’ own production notes point out that roughly 150 periods of data are needed before the smoothing effects are fully absorbed and the reading stabilises.

We call this the Warm-Up Window — the stretch of early data over which an ADX reading is technically calculable but not yet reliable, because it’s still carrying the distortion of wherever your dataset happened to start. StockCharts’ notes make the point concretely: an ADX line calculated from only 30 periods of history will not match one calculated from 150 periods on the very same instrument, even though both are “correct” by the formula.

This isn’t a rounding error you can shrug off. It matters most exactly when Indian retail traders are most tempted to check it: a stock that listed six months ago, a newly launched sectoral index, or any instrument where your charting software only has a short price history loaded. A confident-looking ADX reading on thin history deserves real suspicion, not trust.

The practical fix is unglamorous but reliable: load more history than you think you need before you act on an ADX reading, and treat any reading built on fewer than roughly 150 bars as provisional rather than final.

Reading the ADX Indicator Scale: 0 to 100, Zone by Zone

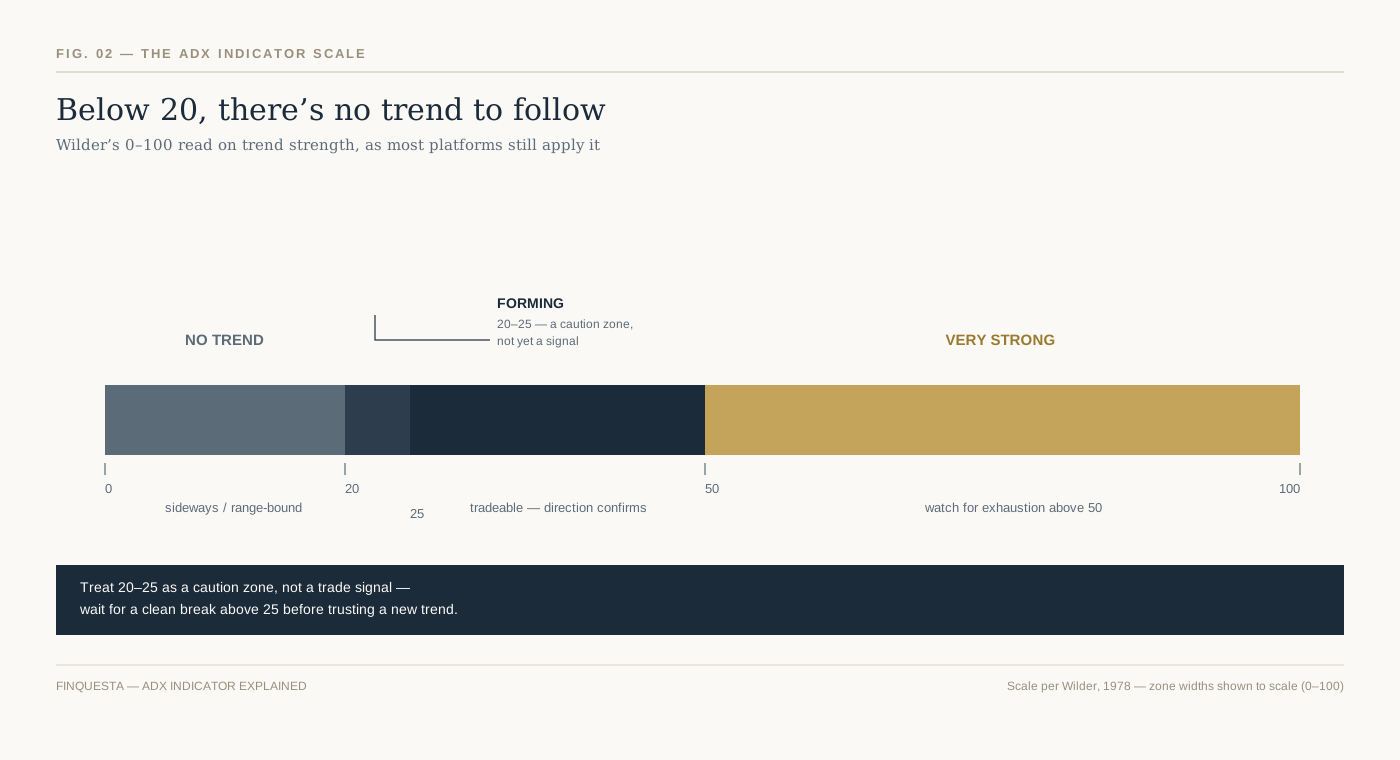
Fig. 2 — Wilder’s 0–100 scale: below 20 is treated as no trend, above 25 as tradeable, above 50 as very strong.

Wilder built the ADX indicator on a 0–100 scale, and the zones traders use today are close to how he originally framed them, refined slightly by decades of collective charting practice.

Below 20, most practitioners read the market as directionless — a range, a chop, a stretch where trend-following systems tend to bleed money on false starts. Between 20 and 25 sits a genuine grey zone: a trend may be forming, but treating it as confirmed this early is how most whipsaw losses happen.

Above 25 is where most trend-following approaches switch on, because the reading now suggests real, tradeable directional conviction rather than noise. Above 50 signals a very strong trend — but strong and tired often arrive together, and a reading up there is as much a caution flag about a stretched move as it is a green light.

None of these thresholds are laws of physics, and treating them that way is the single most common misuse of this indicator. They’re a starting heuristic Wilder built from commodity price data in the 1970s — which is exactly the problem the next section exists to unpack.

The Borrowed Twenty-Five: An Original Finquesta Concept on Why One Threshold Doesn’t Fit Every Market

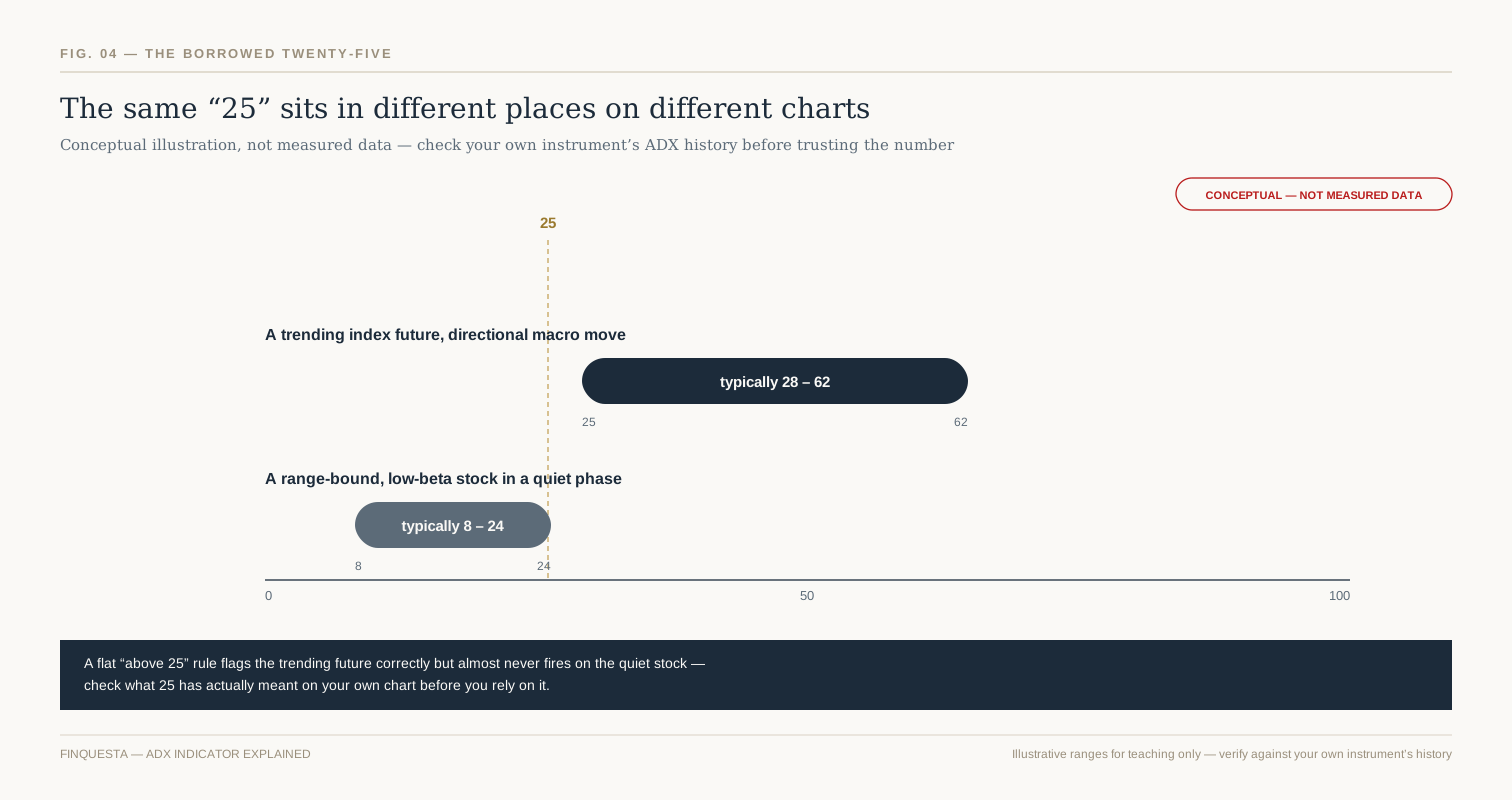
Fig. 4 — The same “25” sits near the floor of one instrument’s typical range and near the ceiling of another’s.

Every ADX explainer repeats “above 25 means a strong trend” as though 25 were a universal constant, like freezing point. It isn’t. It’s a number Wilder backed into from commodity futures data half a century ago, and different instruments today spend their time in genuinely different parts of the 0–100 scale.

We call this the Borrowed Twenty-Five — the habit of applying Wilder’s original threshold to every chart without ever checking whether that specific instrument’s own ADX history supports it. A trending index future in a strong macro move might spend most of its time comfortably above 25. A quiet, low-beta, range-bound stock might rarely cross into the 20s at all, even during its most “trending” stretches — meaning 25 is functionally too high a bar for it to ever clear.

The fix isn’t a different magic number — it’s a habit. Before leaning on the 25 threshold for a specific stock, index, or contract, look back at where that instrument’s own ADX has actually spent most of its time over the last year or two. If it rarely goes near 25, either the threshold needs recalibrating for that instrument, or ADX genuinely isn’t a useful filter there.

This is exactly why a systematic or algorithmic approach to trend-following — the kind covered in Finquesta’s guide to building rule-based trading systems — usually calibrates its own thresholds per instrument rather than hard-coding Wilder’s original number everywhere.

Rising ADX vs. Falling ADX: The Direction Matters More Than the Level

Most beginners fixate on where the ADX line is sitting right now. More experienced traders watch where it’s going.

A rising ADX indicator reading means the current trend, whatever direction it’s pointed, is picking up conviction. A falling ADX means it’s losing conviction — even if the number is still technically “above 25.” An ADX reading of 22 and climbing is often more actionable than a reading of 30 that’s been sliding for the past week, because the first describes momentum building and the second describes momentum draining.

This is where the level-only reading fails traders most often: a market can sit above the 25 threshold for weeks while its ADX quietly rolls over, and a trader watching only the absolute number never gets the early warning that the trend is fading. Watching the slope catches that shift days before the level alone would.

Reading +DI and −DI Crossovers for Trend Direction

Once ADX confirms real conviction exists, the +DI and −DI lines are what tell you which way to lean.

A +DI line crossing above −DI suggests buying pressure has taken control, and the reverse crossover suggests selling pressure has. On its own, a DI crossover in a low-ADX environment is weak evidence — the two lines cross constantly during a range, throwing off signal after signal that goes nowhere. That’s precisely why experienced traders wait for ADX to confirm strength before treating any DI crossover as meaningful.

The strongest combined read isn’t a DI crossover or a rising ADX — it’s both arriving close together: direction and conviction showing up at roughly the same time, rather than one lagging the other by weeks.

A Real Chart Walkthrough: ADX and DI Together

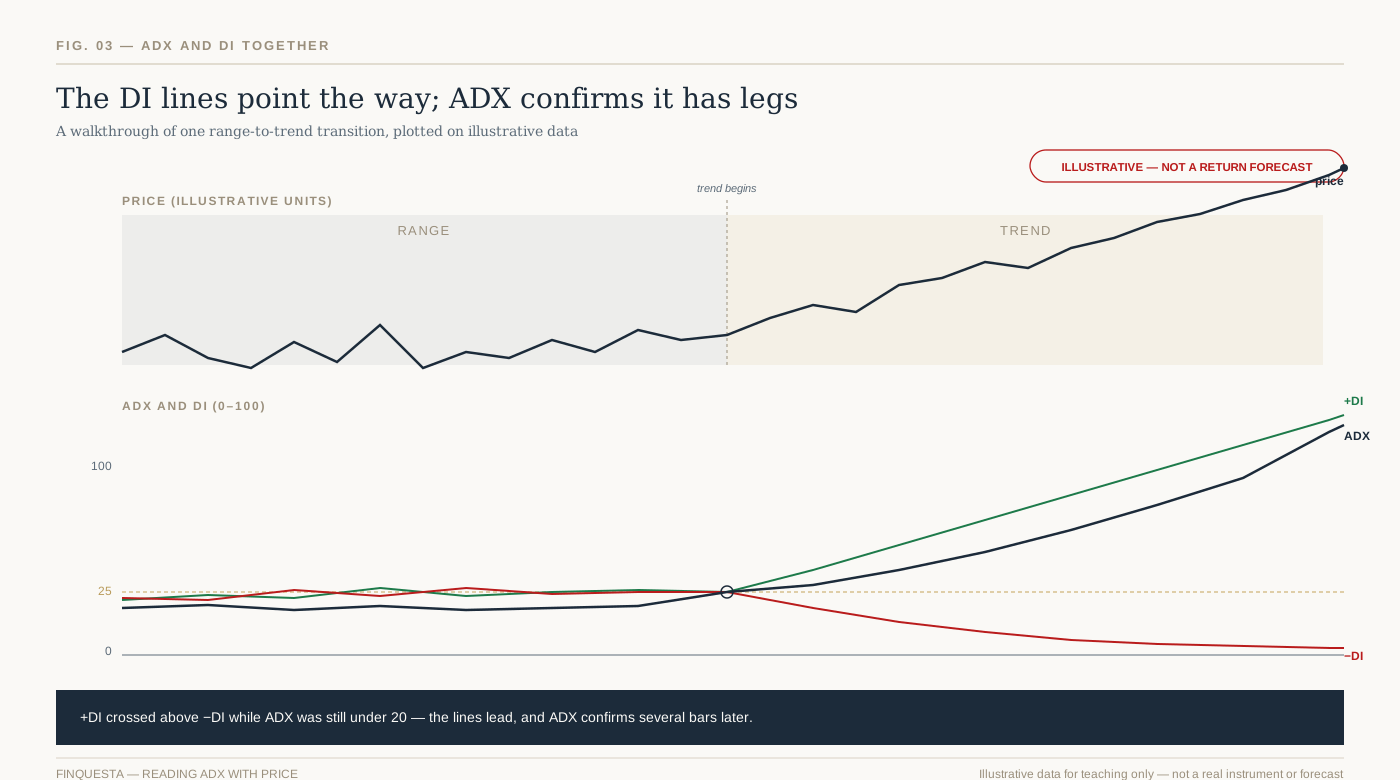
Fig. 3 — Illustrative walkthrough: the DI lines separate first; ADX confirms above 25 several sessions later.

Picture a stock chopping sideways for two weeks, doing nothing decisive, before breaking into a clean uptrend. Overlaying ADX and the DI lines on that same stretch tells a specific, teachable story.

During the sideways period, +DI and −DI cross back and forth repeatedly, and ADX stays pinned under 20 — the indicator correctly reading “nothing worth trading here” even while price bounces around enough to tempt a discretionary trader into acting anyway. Once the breakout begins, +DI pulls decisively ahead of −DI within the first few sessions.

ADX, true to its nature as a lagging, doubly-smoothed line, doesn’t cross above 25 until several sessions after that DI separation has already happened. That gap between the DI lines settling into a clear order and ADX confirming it isn’t a flaw in the indicator — it’s the indicator doing exactly what a smoothed, conviction-measuring tool is supposed to do. Traders who understand that lag use the DI crossover as an early alert and the ADX confirmation as permission to size up, rather than expecting both to arrive on the same candle.

Best ADX Indicator Settings for Scalping, Day Trading, Swing, and Positional Trades

Trading styleTypical periodWhy
Scalping (1–5 min charts)7–9Faster reaction; accepts more noise
Intraday / day trading9–14Balances responsiveness with reliability
Swing trading (daily charts)14 (Wilder’s original)The most widely tested, most widely charted setting
Positional / long-term20–25Smoother line; fewer whipsaws, more lag

Table 2 — Starting points, not fixed rules. Test against your own instrument before relying on any of these.

Adjusting the period is standard practice across all of Wilder’s studies, the ADX indicator included — traders commonly test values anywhere from single digits up to the low 20s, the same way they would tune an RSI period to a specific timeframe. Shortening the period makes the line more sensitive and faster to react, at the direct cost of more false signals; lengthening it smooths out noise at the cost of more lag. There’s no universally optimal number — only a trade-off that should match how long you actually intend to hold a position.

Scalpers and very short-timeframe intraday traders often shorten the period into single digits to get a faster read, accepting that some of those faster signals will be noise. Swing traders on daily charts generally have little reason to deviate from Wilder’s original 14, which remains the most widely tested, most widely charted version across every platform. Position traders sometimes stretch the period past 20 for a smoother, slower line that filters out short-term wobble entirely.

Whatever period you choose, treat it as a starting point to test against your own instrument and timeframe — per the Borrowed Twenty-Five concept above, the threshold you apply matters at least as much as the period you calculate it over.

Using the ADX Indicator on Nifty and Bank Nifty Intraday Charts

Indian F&O traders lean on the ADX indicator constantly, usually without necessarily naming it — it’s one of the standard filters built into screeners like Chartink, sitting alongside RSI, MACD, and moving average crossovers as a stock-scanning criterion. A scan for “ADX above 25 and rising” is a common way traders narrow a universe of NSE stocks down to the handful actually worth watching on a given morning.

On five-minute or fifteen-minute Nifty and Bank Nifty charts specifically, the Warm-Up Window problem from earlier becomes very real: intraday data resets its context every session, so an ADX reading calculated from only the first hour of trading is exactly the kind of thin-history number this guide has already warned you to treat with suspicion. Many intraday traders wait until well into the session, once enough bars have accumulated, before trusting the ADX reading at all.

Options traders watching Bank Nifty specifically tend to combine ADX with implied volatility context rather than reading it alone, since a “strong trend” reading during an unusually high-IV session can mean something quite different from the same reading on a quiet day. The indicator’s core job doesn’t change — it still separates trending conditions from chop — but what counts as a useful trending reading shifts with the backdrop.

Weekly and monthly F&O expiries add another wrinkle worth flagging. Nifty and Bank Nifty often see compressed, pinned price action in the final sessions before expiry, which can drag ADX down even during what was, days earlier, a genuine trend. Reading that expiry-week dip as “the trend is over,” without accounting for the seasonal compression behind it, is a false read specific to Indian index derivatives that’s easy to avoid once you know to look for it.

The ADX Indicator as a Regime Filter in Systematic and Algorithmic Trading

Most retail explainers frame the ADX indicator as a discretionary tool you glance at before clicking buy. Quant and algorithmic traders tend to use the ADX indicator differently: as a regime filter that switches an entire strategy on or off.

The logic is straightforward. Trend-following systems — moving average crossovers, breakout strategies, Supertrend-based entries — perform well in trending conditions and poorly in choppy, range-bound ones, while mean-reversion systems tend to do the opposite. Rather than running a trend-following strategy at all times and eating losses during its bad regime, a systematic trader can code ADX directly into the entry logic: only take trend-following signals when ADX is above a chosen threshold, and stand aside or switch to a different strategy entirely when it isn’t.

Backtesting this kind of filter properly means testing the ADX threshold itself as a parameter — not assuming 25 is correct just because Wilder used it, per the Borrowed Twenty-Five concept — and being honest about the Warm-Up Window when validating results on any instrument with a short listed history. A regime filter built on an unstable early-window ADX reading will look better in a backtest than it performs in live trading, which is a subtle but common way systematic strategies quietly overstate their own edge.

There’s a specific failure mode worth naming for anyone building a machine-learning classifier on top of a trend-versus-range regime label. If that label was itself derived from an ADX threshold, the model is implicitly learning Wilder’s 1978 cutoff as ground truth, Borrowed Twenty-Five problems included. Testing the label’s sensitivity to the threshold — not just the model’s accuracy against one fixed label — is what separates a genuinely robust regime classifier from one that has simply memorised a single cutoff.

For traders building this kind of rule-based system on Indian markets specifically, Finquesta’s deeper guide to algorithmic trend-following walks through backtesting a filter like this properly, walk-forward validation included.

ADX vs. RSI vs. MACD: What Each One Actually Measures

 ADXRSIMACD
What it measuresTrend strength, not directionSpeed and size of recent price movesRelationship between two moving averages
Scale0 to 1000 to 100Unbounded, centred on zero
Best used forDeciding whether to trend-follow at allSpotting overbought/oversold extremesSpotting momentum shifts and crossovers
Common blind spotSays nothing about directionCan stay “overbought” for weeks in a strong trendLags in choppy, low-volatility markets

Table 3 — Three different questions, not three competing answers to the same question.

These three indicators get lumped together constantly because they all live in a pane below the price chart, but they’re answering three genuinely different questions, and confusing them is a common source of contradictory-feeling signals.

The ADX indicator asks whether a trend exists and how strong it is, without any opinion on direction. RSI asks how fast and how far price has moved recently, which is really a momentum and overbought/oversold question, not a trend-strength one. MACD asks whether two moving averages are converging or diverging, blending a trend read with a momentum read into one line.

A market can show a rising ADX — a genuinely strengthening trend — while RSI sits in an unremarkable middle range for weeks, because a steady, orderly trend doesn’t need extreme momentum readings to stay intact. That’s not a contradiction between the two indicators; it’s each one correctly answering a different question. For a full breakdown of the overbought and oversold mechanics this comparison only touches on, Finquesta’s RSI guide goes deeper — traders who expect all three indicators to agree constantly are usually the ones who end up distrusting all three.

Common Mistakes Traders Make With the ADX Indicator

The single most common mistake is the one that cost Aakash his trade in the opening story: reading a high or rising ADX indicator as a buy signal by itself, with no reference to the DI lines or price direction at all. ADX has no opinion on direction, ever — treating it like it does is the fastest way to get the strength right and the direction wrong.

A close second is chasing the 25 crossover the instant it happens, without waiting for confirmation, in fast-moving intraday conditions where the reading can flicker back below the threshold within a few bars. A third is applying the same 25 threshold to every instrument without checking that instrument’s own typical range, which is the Borrowed Twenty-Five problem showing up in live trading decisions rather than just theory.

A fourth, subtler mistake is trusting an ADX reading calculated on a short price history — a recently listed stock, a fresh contract, or the first hour of an intraday session — without accounting for the Warm-Up Window. The number will display cleanly on the screen either way; only one of those readings deserves your confidence.

A fifth mistake shows up specifically around results and news events: a sudden earnings gap or macro headline can spike ADX rapidly without representing the kind of sustained, tradeable trend the indicator was originally built to describe. A one-day volatility shock and a genuine multi-week trend can produce a superficially similar ADX reading, even though only one of them is what most trend-following strategies are actually designed to catch.

Limitations of the ADX Indicator Every Trader Should Know

Sideways, choppy conditions are where the ADX indicator misleads most often. The line can tick upward on nothing more than short-term volatility inside a range, tempting a trader into reading a new trend that was never really there — precisely the whipsaw pattern this guide has already flagged more than once. Acting on those false starts is a common way trend-following systems bleed small losses repeatedly during a listless market.

The ADX indicator is also structurally a lagging one. Because it’s built from smoothed averages of smoothed averages, it confirms that a trend exists well after that trend has already begun, never before. Traders expecting it to anticipate a move rather than confirm one are asking it to do a job it was never built for.

Finally, ADX is entirely non-directional by design, which bears repeating one last time given how often it trips traders up: a rising ADX during a sharp downtrend is just as “strong” a reading as a rising ADX during a sharp rally. Every limitation on this list connects back to the same root cause — ADX is a measurement of conviction, built from history, and nothing more.

One more mix-up is worth naming, because it’s common even among traders who’ve used both tools for years. Average True Range (ATR) and the Average Directional Index (ADX) are different Wilder indicators measuring completely different things, sharing only an author and the word “Average.” ATR measures how much an instrument typically moves in absolute terms, useful for setting stop-losses; ADX measures how directionally consistent those moves have been. Confusing the two in conversation, or worse, in a coded strategy, is a fast way to build something other than what you intended.

How to Add the ADX Indicator on Popular Charting Platforms

MetaTrader 4 ships the ADX indicator built in as standard, filed under the Trend folder of its indicator library, with no separate download required. TradingView and most Indian broker platforms — including the charting tools bundled into Zerodha Kite and similar apps — ship it as a standard built-in indicator as well, typically searchable by typing “ADX” or “Average Directional Index” into the indicator search box.

Once added, it renders in its own pane below the price chart rather than overlaying the candles directly, which is the expected behaviour — if your ADX appears drawn on top of price itself, it’s very likely a different indicator or a misconfigured overlay setting. Most platforms let you adjust the period (14 by default) and choose whether to display the +DI and −DI lines alongside it, which should stay switched on: the ADX indicator without its DI lines is only telling you half the story.

Frequently Asked Questions About the ADX Indicator

What is the ADX indicator in simple terms?

The ADX indicator is a single number between 0 and 100 that shows how strong a price trend is, regardless of whether that trend is up or down. A reading generally under 20 suggests the market is moving sideways, while a reading above 25 suggests a trend with real conviction behind it. It never indicates direction on its own — for that, you need the +DI and −DI lines that come packaged alongside it.

What is a good ADX value for entering a trade?

There’s no single value that works identically across every instrument and timeframe, which is exactly what the Borrowed Twenty-Five concept above addresses. Many traders treat 25-and-rising as a reasonable starting filter for trend-following setups, while readings above 50 often get read as a mature trend that could be nearing exhaustion. It works best as one filter among several — combined with price action and the DI lines for direction — rather than a standalone trigger. Always check what that specific instrument’s ADX indicator has historically looked like before assuming 25 is meaningful for it.

Is the ADX indicator reliable for intraday trading on Nifty and Bank Nifty?

The ADX indicator can be useful intraday, but it lags more on shorter timeframes because Wilder’s smoothing needs time to stabilise, exactly as the Warm-Up Window concept describes. Many Nifty and Bank Nifty intraday traders shorten the period to roughly 7–10 for faster, more responsive readings, accepting more noise in exchange for speed. It tends to work best paired with price action or a volume-based indicator rather than used alone. Expect more false starts during the opening volatility of a session, while ranges are still forming.

Can I lose money using the ADX indicator alone?

Yes — the ADX indicator doesn’t predict future prices, place trades, or manage risk by itself, and no single indicator removes market risk entirely. It measures trend strength from past price data, which makes it a descriptive, lagging tool rather than a predictive one. How you size positions, place stop-losses, and manage the overall trade matters as much as what any one indicator shows. Treat it as one input into a decision, never the whole decision.

What is the difference between ADX and RSI?

The ADX indicator measures how strong a trend is; RSI measures how fast and how far price has moved recently, which is a different question entirely. A market can show a high ADX — a strong trend — while RSI sits in a normal range for extended stretches, because a steady trend doesn’t need extreme momentum to stay strong. RSI is more commonly used to spot overbought or oversold conditions, while ADX is used to decide whether trend-following makes sense right now. Many traders use both together rather than choosing one over the other.

What is the difference between ADX and the Supertrend indicator?

Supertrend sits directly on the price chart and flips between a buy and sell state, giving a clear directional signal along with a trailing stop level. The ADX indicator sits in a separate pane below the chart and only measures how strong whatever trend exists actually is, without ever flipping to a buy or sell state itself. A common systematic approach uses ADX purely as a filter — only acting on Supertrend’s direction changes when ADX confirms a real trend is present. Finquesta’s guide to building rule-based trading systems covers this combination in more depth.

Does a rising ADX mean I should buy?

No — a rising ADX indicator only means the current trend, whichever direction it’s in, is gaining strength. If the market is falling and ADX is rising, that describes a strengthening downtrend, not a buy signal. Direction has to come from the +DI/−DI lines or from price action itself, never from the ADX line alone. Treating “ADX is rising” as a buy trigger by itself is one of the most common misreadings of this indicator.

What is the best ADX setting for scalping versus swing trading?

Scalpers on very short timeframes often shorten the ADX indicator’s period to around 7–9 for faster, more responsive readings, accepting more false signals in exchange for speed. Swing traders working on daily charts generally stay close to Wilder’s original 14-period setting, still the most widely tested and charted version. Position traders sometimes stretch the period to 20 or beyond for a smoother, slower-moving line. There’s no universally “best” number — it’s a trade-off between responsiveness and reliability that should match your holding period.

Can the ADX indicator predict a trend reversal?

Not directly — the ADX indicator is fundamentally a lagging tool built from smoothed historical price data, so it confirms trends after they’ve developed rather than predicting them in advance. Some traders watch for ADX peaking and rolling over from a high level, often above 50, as a hint that a strong trend may be tiring. That pattern is a caution flag at best, not a reliable reversal signal, and needs confirmation from price action before it means anything actionable.

Where the ADX Indicator Fits in Your Trading Toolkit From Here

The ADX indicator’s whole job is narrower than most traders expect going in: tell you whether the current move has real conviction behind it, and stay silent about everything else. That narrowness is a feature, not a limitation — trying to make it answer questions about direction or timing is what leads to trades like the one that opened this guide.

A reasonable next step is pulling up a chart you already know well and checking where its ADX has actually spent most of its time over the last year, rather than assuming Wilder’s 1978 thresholds transfer over untested. Pair that with a look at how candlestick structure confirms or contradicts what the DI lines are showing, and you have a genuinely combined read — strength from ADX, direction from DI, and context from price action itself — instead of a single line asked to do a job it was never built for.

DISCLAIMER This article is for informational and educational purposes only and does not constitute financial, investment, tax, or legal advice. Figures, rates, and regulations mentioned are subject to change; please verify current details with official sources (RBI, SEBI, the Income Tax Department, IRS, or a licensed financial advisor) before making financial decisions. Finquesta may earn a commission from affiliate links in this article at no extra cost to you.
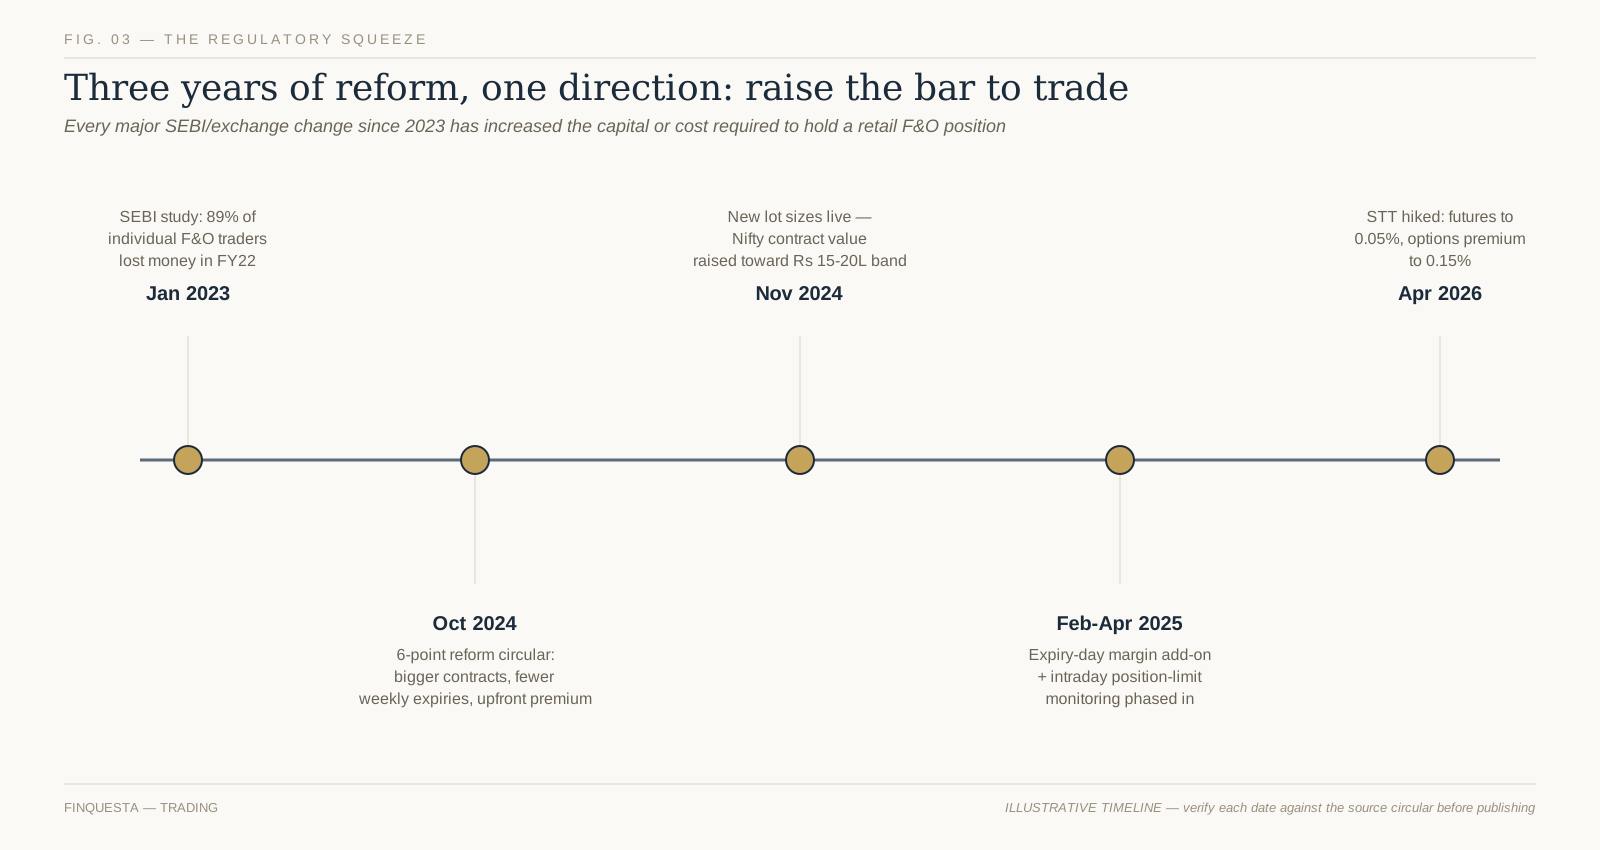
How to Start Trading in India: The Complete Beginner’s Friendly Guide (2026)

How to start trading in india

Most people who tell you they want to “invest in the stock market” are actually describing something closer to trading — checking prices daily, reacting to news, hoping to catch a move within weeks rather than years. Confusing the two isn’t a semantic slip. It’s the single biggest reason beginner trading accounts in India go quiet, or empty, within twelve months of being opened.

This guide is written for the second group — the ones who actually mean trading. It covers what you legally need before your first order, how to read a chart well enough not to be dangerous to yourself, what a trade really costs after brokerage and tax, and the discipline habits that separate people who last from people who don’t.

Table of Contents

What Is Stock Trading, Really?

Stock trading is buying and selling shares of listed companies over a short holding period — anywhere from a few seconds (intraday) to a few weeks (swing trading) — aiming to profit from price movement itself, not the company’s long-term growth. Anyone with a demat account, a trading account, and capital can do it. In India, trading is regulated by the Securities and Exchange Board of India (SEBI), and every share you hold sits in your name at a depository — NSDL or CDSL — which is what actually protects your holdings if your broker runs into trouble.

That single fact — your shares live at the depository, not with your broker — is worth sitting with for a second, because it answers the question most beginners are actually too embarrassed to ask before they open an account: what happens to my money if the broker shuts down. Your cash balance is a different story, which is exactly why the next section exists.

Trading vs Investing: The Difference That Decides Whether You’ll Actually Succeed

Trading and investing use the same app, the same exchange, and often the same stock. That’s exactly why beginners blur them — and why blurring them is expensive. An investor buying Reliance Industries for a ten-year holding period doesn’t care that the stock dropped 3% on results day. A trader holding the same stock overnight cares enormously, because 3% might be their entire risk budget for the week.

Here’s a simple, original framework worth actually using before you place a single order — call it the Time Horizon Test (Original Finquesta framework). Ask yourself three questions about the position you’re about to open:

  1. What’s your exit trigger — a specific price target or date, or “whenever I need the money someday”?
  2. What are you actually evaluating — the chart’s pattern, or the company’s balance sheet and management?
  3. If this position dropped 15% tomorrow morning, would your first move be to check the news, or check your stop-loss?

Two or more answers landing on the first option in each pair means you’re trading, whether you call it that or not — so act like it: use a stop-loss, size the position small, and expect to be wrong close to half the time and still come out ahead on the trades that work. Two or more answers landing on the second option means you’re investing, in which case a single day’s price move barely matters, and a demat account full of trading-app habits (checking it four times an hour) will only cost you sleep and impulsive decisions.

If, honestly, the Time Horizon Test points you toward investing rather than trading, the lower-effort starting point is a systematic monthly investment into a diversified mutual fund rather than picking individual stocks — Finquesta’s guide on how a mutual fund actually works and how to start one walks through that path in full.This guide, from here on, is written for the trading path specifically.

How to Start Trading in India

Fig. 02 — Trading vs investing, compared across exit trigger, evaluation method, and reaction to a 15% drop

How to Start Trading in India: What You Need Before Your First Trade

Three things stand between you and your first order, and none of them are optional.

A PAN card. Every demat and trading account in India is linked to a Permanent Account Number — no PAN, no account, no exceptions, because SEBI requires it for KYC and tax reporting.

A demat account. This is where your shares are held electronically, maintained by a Depository Participant (DP) that’s registered with NSDL or CDSL. Think of it as a bank account, except it holds securities instead of cash.

A trading account. This is the account that actually places buy and sell orders on the exchange — the National Stock Exchange (NSE) or Bombay Stock Exchange (BSE). Your demat account stores what you own; your trading account is how you buy and sell it.

Most brokers today bundle demat and trading into a single “2-in-1” account opened through one online application, so in practice this is one sign-up flow, not three separate ones. You’ll also need a linked bank account for the money to move in and out of, and a mobile number and email registered for OTP-based verification — SEBI’s KYC rules require your identity to be independently verifiable, not just self-declared on a form.

How to Open a Demat and Trading Account in India: Step by Step

The account-opening process itself is almost entirely digital now, and takes most people under thirty minutes if their documents are in order.

Step 1 — Choose a broker. More on how to actually pick one in the next section; for now, know that SEBI-registered brokers all offer largely the same account-opening flow.

Step 2 — Complete e-KYC. You’ll enter your PAN, and the broker verifies it against government records. Aadhaar-based e-KYC, where available, can auto-fill most of your personal details from UIDAI’s records, which is what makes the process fast.

Step 3 — Upload documents. A PAN card copy, an address proof (Aadhaar, passport, voter ID, or a recent utility bill), a cancelled cheque or bank statement for account linking, and a passport-size photo. Most brokers accept phone-camera scans.

Step 4 — In-Person Verification (IPV). SEBI requires a video KYC step — a short live video call or recorded selfie-video confirming you’re a real person matching your documents, not a stolen identity opening an account.

Step 5 — E-sign the account opening agreement. This is done via Aadhaar-linked e-signature (OTP-based), replacing the paper signature process that used to take days.

Step 6 — Fund your account and place your first trade. Once approved — typically same-day to 48 hours — you transfer funds via UPI or net banking, and your trading account is live.

Choosing a Broker: What Actually Matters

The full-service versus discount broker decision gets presented as a beginner’s first big choice, and it’s simpler than it’s made out to be. A full-service broker (typically a bank-affiliated one) bundles research reports, relationship-manager access, and advisory calls into a higher brokerage fee — often a percentage of trade value. A discount broker charges a flat fee per executed order, sometimes near-zero for delivery trades, and gives you the trading platform without the advisory layer.

For a beginner trading their own capital in small size, the maths almost always favours a discount broker: on a modest trade size, a percentage-based brokerage from a full-service broker can eat a meaningfully larger share of your position than a flat ₹20 (or lower) per order. The “research and advice” a full-service broker sells is also something this guide — and Finquesta generally, per Rule 3 of our own editorial policy — won’t substitute with a stock tip either, because the honest answer is that you should be able to explain why you’re in a trade without outsourcing that judgment to anyone’s call.

What genuinely matters more than the full-service/discount label: uptime and order-execution speed during volatile market opens (a platform that lags for ninety seconds at 9:15 AM can cost you more than a year of brokerage savings), the quality of the charting tools built into the app, how clearly the broker discloses charges up front, and whether customer support actually answers when your order is stuck. Read the last three months of app-store reviews before you read a comparison article — including this one.

How to Start Trading in India: Your First 6 Steps

Once your account is live, here’s the sequence that keeps a first trade from becoming an expensive lesson.

1. Fund a small, specific amount — not “whatever’s spare.” Decide the rupee amount you’re willing to lose completely without it affecting your life, and start with that, not your full available capital.

2. Pick one stock you can actually explain. Not a tip from a group chat — a company whose business model you could describe to a friend in two sentences. If you can’t, you’re not ready to size a position in it.

3. Check the chart before you check the price. A stock trading near a level it’s failed at three times before is telling you something a headline won’t. (More on this in the candlestick sections below.)

4. Choose your order type deliberately — not whatever the app defaults to. The next section covers why this single choice is where most beginner losses actually originate.

5. Set your stop-loss the moment you enter, not after the trade starts moving against you. A stop-loss decided in advance is a plan; a stop-loss decided while watching the price fall is usually a rationalisation.

6. Log the trade — entry price, exit price, and the reason you took it — win or lose. This single habit, more than any indicator, is what turns a string of random outcomes into an actual improving process.

Understanding Order Types: Market, Limit, and Stop-Loss

The order type you pick is not a technicality — it’s the single most common place a beginner loses money before the market even moves against them.

A market order executes immediately at the best available price. It guarantees execution, not price — in a fast-moving or thinly traded stock, the price you actually get can differ meaningfully from the price you saw on screen a second earlier. This gap is called slippage, and it’s the quiet tax new traders pay without realising it.

A limit order executes only at your specified price or better. You control the price; you give up the guarantee of execution — your order might simply never fill if the stock never reaches your level.

A stop-loss order sits dormant until the price hits a trigger you set, at which point it converts into a market (or limit) order to exit the position. This is the single most under-used order type among beginners, and the most important one: it’s what makes “I’ll get out if it goes wrong” an actual instruction to the exchange instead of a promise to yourself that panic overrides.

The beginner mistake worth naming directly: placing a market order to enter a volatile, low-liquidity small-cap stock right at market open. Spreads are widest and slippage is worst in the first few minutes of trading, precisely when beginners — excited to place their first order — are most likely to click buy.

How to Read a Stock Chart Before You Trade It

Every price chart is a record of a negotiation — buyers and sellers disagreeing about what a stock is worth, with price as the running scoreboard. Most beginners look at a chart and see a random squiggly line. Traders who last look at the same chart and see a story about who’s currently winning that negotiation, one candle at a time.

Before candlesticks specifically, two things worth knowing about any chart: the timeframe (a 5-minute chart and a weekly chart of the same stock can look like they’re describing two different companies — always check which one you’re looking at), and the volume bars usually printed beneath the price, which tell you how much conviction is behind a given move. A price breakout on low volume is a much weaker signal than the identical breakout on volume triple the recent average.

How to Read Candlestick Charts: The Anatomy of a Single Candle

A candlestick chart looks intimidating the first time you see one — a wall of red and green rectangles that reads like nothing at all. Once you know what a single candle is actually recording, that wall turns into a fairly simple story about who won each round: buyers or sellers.

Each candle represents one fixed period of time (a minute, an hour, a day — set by the chart’s timeframe) and records four numbers: the open (price when the period started), the close (price when it ended), the high (the peak reached), and the low (the trough reached). The thick rectangular part is called the body — it spans from the open to the close. The thin lines above and below the body are the wicks (or shadows) — they mark the high and low, the furthest the price reached before pulling back.

Colour tells you direction at a glance. A green (or unfilled/white) candle means the close was higher than the open — buyers won that round. A red (or filled/black) candle means the close was lower than the open — sellers won. A long body means one side dominated the entire period with conviction; a short body with long wicks on both ends means a genuine tug-of-war, with neither side able to hold control by the close.

This is the entire vocabulary a candlestick chart is written in. Everything else — every named pattern — is just a specific, recognisable arrangement of these same four numbers repeating in a way traders have learned to recognise.

Trading

Fig. 01 — A single candle’s anatomy: open, close, high, low, body, and wick

Five Candlestick Patterns Worth Actually Knowing as a Beginner

Trading blogs love listing forty candlestick patterns. In practice, a beginner who deeply understands five will out-trade someone who’s memorised forty without understanding any of them, because pattern recognition without context is just superstition with better branding.

The Doji. Open and close are nearly identical, producing a candle that’s almost all wick and barely any body. It signals indecision — neither buyers nor sellers won this round — and is far more meaningful after a strong trend than in the middle of a sideways, directionless stretch.

The Hammer. A small body near the top of the candle’s range, with a long lower wick — at least twice the body’s length — and little to no upper wick. After a downtrend, it suggests sellers pushed price down hard during the period, but buyers stepped in and dragged it back up before the close. On its own it’s a hint, not a signal; traders typically wait for the next candle to confirm before acting on it.

The Shooting Star. The Hammer’s mirror image — a small body near the bottom, a long upper wick, appearing after an uptrend. It suggests buyers pushed price up, but sellers overwhelmed them before the close, and is read as a possible reversal signal in the opposite direction from the Hammer.

The Bullish Engulfing pattern. A two-candle pattern: a small red candle followed by a larger green candle whose body completely “engulfs” the prior candle’s body, top to bottom. It suggests a decisive shift in control from sellers to buyers within a single period.

The Bearish Engulfing pattern. The mirror image — a small green candle followed by a larger red candle that fully engulfs it, suggesting sellers just took decisive control from buyers.

The honest caveat every credible source should give you and most don’t: no candlestick pattern is a reliable signal in isolation. Professional traders use them alongside volume, support/resistance levels, and the broader trend — never as a standalone trigger to place a trade. Treat this section as vocabulary, not a system.

Intraday Trading vs Delivery Trading vs F&O: Picking Your Lane

Delivery trading means you buy shares and they land in your demat account — you can hold them for a day, a month, or a decade, and you owe nothing until you sell. It’s the lowest-pressure way to trade, since there’s no same-day deadline forcing a decision.

Intraday trading means you buy and sell (or sell and buy — “short selling”) the same stock within the same trading session, closing the position before the market shuts, without ever taking delivery into your demat account. It typically uses leverage the broker extends for the day, which magnifies both gains and losses, and it’s taxed differently, which the tax section below covers in detail.

Futures & Options (F&O) trading uses derivative contracts whose value is based on an underlying stock or index, rather than the stock itself. It offers the highest leverage of the three — and correspondingly the highest capacity to lose money fast, including in some structures, more than your original capital. SEBI has progressively tightened F&O eligibility and lot-size rules in recent years specifically because retail losses in the segment have been so heavily skewed negative.

For a genuine beginner, delivery trading is the only one of the three with no clock forcing a decision — which makes it the only one where a first mistake is a learning experience rather than a same-day margin call. Intraday and F&O are not “more advanced versions of the same thing you should graduate into” — they’re structurally different risk instruments, and treating them as a natural next step rather than a deliberate, separate decision is exactly how disciplined delivery traders end up in F&O positions they don’t understand.

How Much Money Do You Actually Need to Start Trading in India?

There’s no SEBI-mandated minimum capital to open a demat and trading account, and several brokers let you place your first delivery trade with capital in the low hundreds of rupees, since Indian equities can be bought in single shares rather than fixed lot sizes (unlike F&O, which trades in exchange-defined lot sizes).

The more useful question than “what’s the minimum” is “what makes practising worthwhile.” An amount too small to notice losing teaches you nothing about your own discipline under pressure — the entire point of starting small is to make mistakes that sting just enough to be memorable, without being financially serious. A starting amount you could comfortably lose entirely and still meet next month’s expenses without stress is the right test, not any specific rupee figure a blog gives you.

The Real Cost of Trading: Brokerage, STT, and Other Charges

Every trade costs more than the brokerage fee your app shows you upfront, and understanding the full stack is what separates a trader who tracks real profitability from one who’s quietly losing money to charges while feeling like they’re breaking even.

Brokerage. What your broker charges per order — either a flat fee or a small percentage of trade value, capped at a flat maximum by most discount brokers.

Securities Transaction Tax (STT). A tax the government charges automatically at the time of the trade — you don’t calculate or pay it separately; it’s deducted in the contract note. According to Zerodha’s published rate table (current from 1 April 2026, following the Budget 2026–27 revision), STT on equity delivery trades is 0.1% of trade value on both the buy and sell side; on equity intraday trades it’s 0.025% of trade value on the sell side only; and on F&O, futures carry 0.05% on the sell side while options carry 0.15% of either the premium (when sold) or the intrinsic value (when exercised) — all of which rose from the pre-April-2026 rates as part of that Budget’s F&O tax changes.

Exchange transaction charges, SEBI turnover fees, stamp duty, and GST on brokerage. Individually small, collectively real — a full, current breakdown lives on your broker’s own charges page, since exact per-segment figures shift periodically and your broker’s contract note is the authoritative record for what you actually paid.

Depository Participant (DP) charges. A per-scrip charge levied by your DP each time you sell shares out of your demat account (delivery trades only) — separate from brokerage, and easy to forget when estimating a trade’s true cost.

The habit worth building from week one: check your contract note after every trade, not just your profit-and-loss number. A trade that looks like a small win on the price chart can be a net loss once every charge above is subtracted — and you’ll never know that if you’re only ever looking at the price.

Fig. 03 — Securities Transaction Tax by trading segment, effective 1 April 2026

Taxation on Trading Gains in India

This is a section beginners either skip entirely or get wrong in the same predictable way — treating all trading profit as one tax category, when India’s rules split it into genuinely different treatments depending on what kind of trading you did.

Delivery-based trades held over 12 months are taxed as long-term capital gains (LTCG) on listed equity. Delivery-based trades held under 12 months are taxed as short-term capital gains (STCG). Both have specific rates and thresholds set by the current Finance Act, which change with the annual Union Budget — always confirm the figure in effect for the financial year you’re filing before relying on it.

Intraday trading profit is treated entirely differently — not as a capital gain at all, but as speculative business income under Section 43(5) of the Income Tax Act, because you never actually took delivery of the shares. This means it’s taxed at your applicable income-tax slab rate — the same slabs your salary is taxed under — rather than at a flat capital-gains rate, and it’s reported under “Profits and Gains from Business or Profession” on your return, not the capital gains schedule. One rule worth knowing before it costs you a refund: speculative losses can only be set off against speculative gains — not against your salary, other business income, or capital gains from delivery trades — though they can be carried forward for four assessment years if you file your return by the due date.

F&O trading profit is also treated as business income (non-speculative, unlike intraday equity), taxed at slab rate, with its own tax-audit threshold rules depending on turnover.

None of this is a substitute for a chartered accountant once your trading activity is non-trivial — it’s the mental model you need to understand what your CA is actually calculating, and to know which documents (contract notes, the year’s P&L statement from your broker) you need to hand over at filing time.

Risk Management: The Discipline Most Beginners Skip

Every trading guide mentions risk management in a paragraph and moves on. It deserves more than that, because it’s the actual difference between traders who are still trading in three years and the much larger group who aren’t.

Position sizing comes first: never risk more on a single trade than you’re prepared to lose on several trades in a row, because you will lose several in a row — that’s not pessimism, it’s the base rate for anyone trading with a real edge, let alone without one. A common starting discipline is risking no more than 1-2% of total trading capital on any single position’s stop-loss distance, which means a string of five consecutive losses costs you 5-10% of capital, not 50%.

Here’s a second original framework worth adopting outright: the Two-Loss Rule (Original Finquesta framework). After two consecutive stop-losses are hit in the same trading session, you stop trading for the day — full stop, no exceptions, no “one more trade to win it back.” This single rule exists because the psychological state after two losses in a row — the urge to immediately recover the loss — is precisely the state in which traders abandon their own plan and take a third, oversized, poorly-reasoned trade. The Two-Loss Rule isn’t about the third trade being statistically doomed; it’s about removing your own judgement from the decision at the exact moment it’s least trustworthy.

Journaling every trade, mentioned earlier in the six-step sequence, is what makes both of these rules enforceable over time rather than good intentions you abandon after a good week.

Fig. 04 — The Two-Loss Rule: after two consecutive stop-losses in one session, trading stops for the day

Common Beginner Mistakes That Empty Trading Accounts Fast

Trading with money you can’t afford to lose. Not a cliché — the single largest predictor of poor decision-making under pressure, because every trade becomes emotionally loaded when the outcome actually matters to your rent.

Averaging down without a plan. Buying more of a losing position “to lower the average price” can be a deliberate, pre-planned strategy for a long-term investment. For a trade that was supposed to have a stop-loss, it’s usually just a stop-loss you decided not to honour, dressed up as a strategy after the fact.

Overtrading. Placing trades out of boredom or the urge to be “doing something” during flat, directionless market stretches, rather than waiting for a setup that actually matches your plan.

Chasing a stock after a big move. Buying because a stock “already moved 8% today and might keep going” is buying based on the fact that you missed the move, not based on any actual signal that more is coming.

Ignoring position sizing on leveraged products. Treating an F&O lot the same way you’d size a delivery trade, without adjusting for the leverage embedded in the instrument, is how a manageable-looking mistake becomes an account-ending one.

Confusing a broker’s research call with your own analysis. Acting on a tip — from a broker, a friend, or a social media account — without being able to independently explain the trade is the fastest way to hold a position you don’t know how to manage when it moves against you.

Building a Simple First Watchlist and Trading Routine

A watchlist of 40 stocks is not a strategy, it’s noise — you can’t meaningfully track that many companies’ news, charts, and price action at once, and most beginners end up reacting to whichever of the 40 happens to be moving that day rather than trading with any plan. Five to eight stocks, in businesses you can actually explain and sectors you have some genuine familiarity with, is a far more workable starting list.

A simple routine beats an elaborate one you’ll abandon within a month: check your watchlist before market open for overnight news, note which levels (from your charts) matter for the day, place any planned orders with stop-losses attached at entry, and — critically — log the day’s trades that evening while the reasoning is still fresh, not three weeks later when you’re trying to reconstruct why you took a trade from memory. For more on building out a broader investing and market-literacy foundation alongside your trading practice, Finquesta’s guide to understanding the Indian stock market is a useful next stop.

It’s also worth periodically stepping back and revisiting Finquesta’s broader guide to investing in Indian stock markets — not because trading and investing are the same activity, but because understanding the investing side of the market makes you a better-informed trader, not a worse one. Every regulated venue you’ll trade on ultimately answers to SEBI’s investor protection framework, and every order you place is executed on an exchange — primarily the NSE or BSE — whose own published market data is worth getting comfortable reading directly rather than only through your broker’s app.

Frequently Asked Questions About Starting to Trade in India

Yes — stock trading through a SEBI-registered broker on the NSE or BSE is fully legal, and your shares are held safely at an independent depository (NSDL or CDSL) regardless of what happens to your broker. “Safe” refers to the regulatory structure protecting your holdings, not to the trades themselves — trading capital can still be lost through normal market risk and poor decisions.

Can I start trading with ₹500 or ₹1,000?

Yes, for delivery-based equity trading, since Indian shares can be bought individually rather than in fixed lots. Whether that amount is enough to meaningfully practise the habits this guide covers is a separate question — very small amounts make losses too painless to teach real discipline, and gains too small to matter either.

What is the difference between trading and investing?

Trading aims to profit from short-term price movement over days to months, using charts and technical signals; investing aims to build wealth over years by owning a share of a growing business. The Time Horizon Test earlier in this guide is a quick way to work out which one you’re actually doing with any given position.

Do I need a demat account to trade, or just a trading account?

You need both for delivery-based trading — the demat account holds the shares you own, and the trading account executes the buy and sell orders. Most brokers open them together as a single “2-in-1” account. Pure intraday trading, where you never take delivery, still typically requires both to be opened as part of account setup, even though shares never actually settle into the demat account.

How much tax do I pay on trading profits in India?

It depends entirely on what kind of trade it was: delivery trades held over or under 12 months are taxed as long-term or short-term capital gains respectively, at rates set by the current Finance Act; intraday trades are taxed as speculative business income at your regular income-tax slab rate; and F&O trades are taxed as non-speculative business income, also at slab rate.

Can I lose more money than I invested in stock trading?

In plain delivery-based equity trading, no — the most you can lose is what you put in, since you own the shares outright. In leveraged segments like F&O, yes — certain option-selling and futures positions can generate losses larger than your initial margin, which is exactly why this guide treats F&O as a structurally different, higher-risk instrument rather than a natural next step from delivery trading.

Is intraday trading better than delivery trading for beginners?

No — delivery trading is the more forgiving starting point precisely because it has no same-day deadline forcing a decision, which gives a genuine beginner room to learn from a mistake instead of being forced to realise it by 3:30 PM. Intraday’s leverage and time pressure are usually a poor match for someone still building basic chart-reading and order-management skills.

How long does it take to learn how to read candlestick charts?

The core vocabulary — open, close, high, low, body, and wick, plus a handful of patterns like the ones covered in this guide — can genuinely be learned in an afternoon. Reading a chart well enough to trade on it with any consistency is a different, much longer skill, built through logged practice across many real trades, not through memorising pattern names.

What is the minimum capital needed for F&O trading in India?

This varies by contract, since F&O trades in exchange-defined lot sizes rather than individual units, and margin requirements are set per instrument and can change with volatility and SEBI’s evolving retail-suitability rules for the segment

Which is better for beginners: a full-service or a discount broker?

For someone trading their own capital in modest size, a discount broker’s flat, low per-order fee usually beats a full-service broker’s percentage-based brokerage on pure cost — and the “research and advisory” a full-service broker adds is something this guide would encourage you to be able to replicate yourself before you trade on anyone else’s call, including ours.

Master Candlestick Charts: A Beginner’s Guide to Trading Confidently[2026]

Candles

A candlestick chart plots a stock, index, or any tradable instrument’s price using individual “candles” — each one showing the open, high, low, and close for a fixed period, whether that’s one minute, one day, or one week. Traders read the size, colour, and position of each candle to judge who’s winning the pull between buyers and sellers. You don’t need a paid terminal to start: NSE, BSE, and every global exchange display candles by default on free charting tools, and reading them well is a skill built through repetition, not memorisation.

Open any stock chart on Kite, TradingView, or Fyers and the first thing you notice is a wall of small red and green rectangles stacked side by side. To someone new to the markets, it can look like decoration sitting on top of a line that’s really just telling you whether a stock went up or down. To someone who has spent real time with it, every one of those rectangles is a compressed argument: buyers pushing one way, sellers pushing back, and the candle is simply where that argument landed by the time the period closed.

This guide covers the actual mechanics of candlestick chart basics — not just what a Doji or a Hammer looks like, but what a candle is built from, why the same pattern behaves differently on different stocks, and a couple of practical checks that matter more than memorising pattern names ever will.

One more thing worth knowing before diving in: this is a genuinely old technique, not a recent trend. Candlestick charting is popularly credited to eighteenth-century Japanese rice trader Munehisa Homma, though the attribution itself is treated as contested by some historians. What’s better corroborated is that the technique reached Western trading desks largely through Steve Nison’s 1991 book on the subject — which is where a lot of today’s candlestick chart basics, as taught in English, ultimately trace back to. None of that changes how you read a candle this afternoon, but it’s a useful reminder that generations of traders have leaned on this exact tool.

The Four Numbers Every Candle Encodes: Open, High, Low, Close

Strip away everything else and a single candle is just four numbers: the open, the high, the low, and the close for whatever period you’ve chosen — a minute, an hour, a day, a week. Say a stock opens a session at ₹500, climbs to an intraday high of ₹512, dips to a low of ₹495, and finishes the day at ₹508. That’s the entire raw material for one candle — this specific set of numbers is a made-up example for illustration, not a real quote from any stock.

The chart draws this visually so you can absorb it in half a second instead of reading four numbers off a table. The thick part of the candle — the “real body” — spans the distance between the open and the close. The thin lines above and below it — the wicks, sometimes called shadows — mark the high and the low, wherever they landed outside the body. Figure 1 breaks this down.

Candles

Figure 1 — Every candle you’ll ever look at reduces to these four numbers.

Once you can read a single candle this way, you’ve already absorbed the harder half of candlestick chart basics. Everything from here is really just combinations and context.

Reading the Body and the Wicks

The real body tells you the outcome — where buyers and sellers settled the argument by the close. The wicks tell you how they got there. A long upper wick means price pushed higher during the period but got rejected and pulled back before the close — sellers showed up near the top. A long lower wick means the opposite: price got sold off hard at some point, but buyers stepped in and dragged it back up before the period ended.

A candle with almost no wicks — where the open and close sit close to the high and low — tells you the move was largely one-directional, with very little pushback. A candle with long wicks on both ends and a small body tells you the two sides fought to a draw; price whipped around but ended up roughly where it started.

None of this requires memorising a pattern name. It’s closer to reading body language than reading a rulebook.

One habit worth building early: before you even consider what pattern a candle might belong to, describe it out loud in plain language first — “small body, long lower wick, closed near the high.” Naming the pattern too quickly is how beginners end up seeing Hammers and Dojis everywhere, whether or not the shape actually earns the label.

Bullish vs Bearish Candles: The Simplest Signal You’ll Learn

Here’s the one rule that everything else in candlestick chart basics sits on top of: if the close is above the open, the candle is bullish — usually shown in green or white. If the close is below the open, it’s bearish — usually red or black. Figure 2 lines several of each up side by side so the pattern in the colour becomes obvious at a glance.

Bullish

Figure 2 — Colour alone tells you what happened, not why, and not what happens next.

That’s genuinely the whole rule for a single candle. A string of bullish candles usually — not always — means buyers have been in control across that stretch. A string of bearish candles usually means the opposite. The nuance beginners skip is in that word “usually.” Colour alone tells you what happened. It doesn’t tell you why, and it doesn’t tell you what happens next. That’s where most of the real skill in reading these charts actually lives.

Why Most Beginners Misuse Candlestick Patterns

Here’s a hard truth worth hearing early, and one that will save you a lot of wasted study time: no candlestick pattern works the same way every time, on every stock, in every market condition. A Hammer that shows up on a heavily traded large-cap after a broad market sell-off behaves differently from the same-looking candle on a thinly traded small-cap during a quiet, illiquid afternoon. Every script has its own personality — its own typical range, its own volume rhythm, its own reaction to news — and a pattern with a good hit rate on one name can be close to meaningless on another.

This isn’t a reason to ignore candlesticks. It’s a reason to treat every pattern as a probability nudge, not a signal. You will not find a 100%-accurate candlestick strategy, and it’s worth being suspicious of anyone who claims to have one. What you can get, with practice, is a slightly better read on which side currently has the upper hand — and that, compounded across enough decisions over time, is genuinely useful. Momentum, not a memorised shape, is what most experienced chart-readers actually pay attention to first. A recognisable pattern is a prompt to look closer, not a green light to act.

The Most Widely Recognised Patterns in Candlestick Chart Basics

With that caveat firmly in place, it’s still worth knowing the vocabulary, because it gives you a fast way to describe what you’re looking at.

A Doji has an open and close that land almost on top of each other, producing a body so small it looks like a cross or a plus sign. It signals indecision — neither side won convincingly during that period.

A Hammer forms after a decline: a small body near the top of the range with a long lower wick and little to no upper wick. It suggests sellers pushed price down hard, but buyers absorbed that selling and dragged it back up by the close. An Inverted Hammer looks similar but with the long wick on top instead, appearing after a decline and hinting that buyers tried to push higher, even if they didn’t fully hold it.

A Shooting Star looks like an Inverted Hammer but appears after an advance rather than a decline — a small body near the bottom of the range with a long upper wick, suggesting buyers pushed higher during the period but lost control before the close.

A Bullish Engulfing candle is a bullish candle whose real body completely covers the real body of the prior bearish candle — a sign that buyers didn’t just show up, they overwhelmed the previous session’s selling. A Bearish Engulfing candle is the mirror image.

A Morning Star is a three-candle sequence — a bearish candle, then a small-bodied indecisive candle, then a strong bullish candle — often read as a bottoming sequence. An Evening Star is the same shape inverted, often read as a topping sequence.

A Spinning Top has a small body with wicks of similar length on both sides — indecision again, but without the extreme range of a Doji.

Three White Soldiers is a sequence of three consecutive bullish candles, each closing higher than the last and each opening within the prior candle’s body — read as sustained, broadening buying pressure rather than a single burst. Three Black Crows is the bearish mirror image. A Marubozu is a candle with little or no wick on either end — the open sits at the low (or high) and the close sits at the high (or low) — signalling that one side controlled the entire period from start to finish, without any real pushback. These are foundational vocabulary for candlestick chart basics, even if none of them, alone, tells you what happens next.

Every one of these describes a shape. None of them describes a guarantee. Some traders track how often each pattern actually leads to a continued move on the specific stocks or indices they follow — and that figure varies enough from instrument to instrument that quoting one universal win rate for, say, a Hammer, would be misleading rather than helpful.

The Half-Body Hold Rule — An Original Finquesta Framework

This is where a lot of beginner explanations stop — list the pattern, move on. But a pattern is only half the story; whether it holds is the other half, and that’s the part almost no beginner guide spells out as an actual check you can run.

Here’s a simple original Finquesta framework for it, built from a habit many working traders develop informally without ever quite naming it: after a signal candle — a strong bullish or bearish move — look at where the real body of that candle sits, and mark its halfway point. Then watch what the next candle does. If the next candle’s close stays above that halfway mark (for a bullish signal candle), the move has held; buyers defended at least half of their gain, and the signal has some real backing. If the next candle closes back below that halfway mark, treat the original signal with real suspicion — the move gave back more than half of itself in a single period, which is often a sign the initial push lacked real conviction. Figure 3 shows both outcomes side by side.

The-Half-Body-Hold-Rule

Figure 3 — The same signal candle, two very different follow-throughs.

We’re calling this the Half-Body Hold Rule mainly so it’s easy to refer back to — it isn’t a law of physics, and it hasn’t been backtested here across every instrument and timeframe. If you run your own numbers on it and the results differ from what’s described here, trust your own data over this framework. What it is: a fast, repeatable gut-check that turns “does this candle look promising” into a slightly more objective question you can answer just by watching what the next candle does.

Momentum Isn’t Uniform Across Stocks

Two stocks can print the exact same-looking candle on the exact same day and mean two very different things. A large, liquid, heavily tracked stock tends to have its candles driven by broad participation — a big bullish candle usually reflects real, broad-based buying. A thinly traded small-cap can print an equally large candle on a fraction of the volume, sometimes driven by one or two large orders rather than a genuine shift in sentiment.

This is really the same idea from the previous section, applied more broadly: every script behaves differently, and a rulebook written for one kind of stock doesn’t transfer cleanly to another. Before you lean on any candlestick signal, it’s worth knowing your own instrument’s typical behaviour — its normal daily range, its normal volume, how it has reacted to similar-looking candles in the past. A five-minute chart on an index future and a daily chart on a mid-cap stock are, in a real sense, different languages that happen to use the same-looking punctuation.

This is why experienced traders often keep informal notes on the handful of stocks they follow closely: typical daily range, typical volume, how the stock has behaved around its own past earnings or news events. That kind of instrument-specific memory does more for reading candles well than any universal pattern list, because it tells you what “normal” actually looks like for that particular script before you try to judge what “unusual” means.

The Snapback-Resume Range — An Original Finquesta Framework

Stocks that move quickly in one direction tend to attract a specific kind of behaviour afterward, and it’s worth naming explicitly because it trips up a lot of beginners. When a stock or index stretches somewhere in the rough range of 5% to 20% in a short window — a handful of sessions, not months — it has historically tended to see some kind of pause or pullback before continuing, rather than moving in a straight line forever. Traders sometimes describe this general idea, in its broadest form, as mean reversion, or informally as a stretched elastic “snapping back” toward its average. What’s less often spelled out for beginners is the second half of it: that snapback frequently isn’t the end of the story. If the underlying momentum behind the original move was genuinely strong — driven by a real shift in fundamentals, broad participation, or a structural change in the stock’s story — the original direction often reasserts itself once the snapback runs its course, rather than the move fully reversing into a new downtrend.

We’ll refer to that combined pattern — stretch, snapback, and potential resumption — as the Snapback-Resume Range. Like the Half-Body Hold Rule above, this is a heuristic built from experienced observation, not a backtested statistic, and the exact percentages will vary by stock, sector, and market regime. Treat the 5%–20% figure as a rough zone to watch, not a trigger to act on by itself.

Round Numbers as Psychological Support and Resistance

Markets have a well-documented habit of treating round numbers as if they mean something more than the number itself. On the Nifty 50, that shows up as clustering around levels like 24,000, 24,500, and 25,000 — round, memorable, easy-to-quote figures that traders, options desks, and algorithms all watch simultaneously.

Figure 4 illustrates the idea using stylised, made-up data rather than a live feed.

Round-Numbers-as-Psychological-Support-and-Resistance

Figure 4 — Illustrative only. Always check the live level before applying this.

Why do round numbers matter at all? Partly psychology — a trader is more likely to set a mental target at “25,000” than at “24,847.” But in Indian derivatives markets specifically, there’s a second, more structural reason: option strikes are listed at round intervals, and open interest tends to build up heavily around round strikes. That concentration of positions can itself influence how price behaves near those levels, especially close to expiry — a dynamic sometimes discussed under the umbrella of “max pain.”

A simple way to use this: before assuming a candlestick signal near a round number means what it would mean elsewhere, ask whether that round number itself might be doing some of the work.

Why Round-Number Sensitivity Varies by Instrument

Not every round number matters equally, and not every stock respects them the same way. An index with heavy options open interest — like the Nifty or Bank Nifty — tends to show more visible round-number behaviour than an individual stock with light derivatives activity. A stock trading at ₹47 doesn’t have the same relationship with ₹50 that the Nifty has with 25,000, simply because far fewer large, round-number-anchored positions sit on top of it.

This is another version of the same underlying lesson running through this whole guide: read the specific instrument in front of you, not a generic rule copied from somewhere else.

Where available, a quick glance at a stock or index’s options chain adds another data point: heavy open-interest build-up at a specific strike is a rough proxy for where the market currently expects, or wants, price to gravitate toward — at least until that view changes.

Volume — The Confirmation Layer Most Beginners Skip

A candle tells you what price did. Volume tells you how much conviction was behind it. The same-looking bullish candle means something very different on unusually high volume versus on a quiet, below-average session.

A useful sizing habit: check what a typical daily move looks like in points for whatever you’re watching, relative to its level. On the Nifty, for instance, a 0.5% move works out to roughly 120 points when the index is trading near 24,000.

A candle with an unusually large body relative to that typical daily move, on unusually high volume, carries more weight than a similarly large body on ordinary or below-average volume — the first looks like real, broad participation; the second can just be a temporary imbalance from a handful of large orders. Figure 5 shows this side by side.

Volume-the-Confirmation-Laye- Most-Beginners-Skip

Figure 5 — Same-sized candle, very different story once you check volume.

Volume doesn’t need its own chapter of pattern names. Mostly, it’s a filter: high volume raises your confidence in what the candle is showing you; low volume should lower it.

It’s also worth remembering that volume has its own rhythm through the day. Many Indian stocks see heavier activity in the first and last hour of the trading session, with a quieter stretch around midday. A candle that looks unusually high-volume mainly because it printed during that opening rush deserves a slightly different read than one that stayed heavy right through an otherwise quiet part of the session.

Timeframes Change the Story

The exact same candle shape means something different depending on the timeframe it’s drawn on. A large bullish candle on a 5-minute chart might represent a few minutes of aggressive buying that has no real bearing on where the stock closes for the day. The same-shaped candle on a weekly chart represents an entire week of buyers overpowering sellers — a much heavier signal.

This matters most when you’re deciding how to apply everything covered above. If you’re trading intraday, your “signal candle” and your “confirmation candle” for the Half-Body Hold Rule might both be 5-minute or 15-minute candles, checked within the same session. If you’re a positional or swing trader, you’d naturally look at daily candles instead, and give the setup more time to play out. Applying an intraday mindset to a positional chart — or the reverse — is one of the more common, avoidable mistakes beginners make. Match your candle timeframe to how long you actually intend to hold the position.

It also helps to notice how the same stretch of time compresses as you zoom out. Twenty 15-minute candles roughly cover a single trading session; twenty daily candles cover about a month; twenty weekly candles cover four to five months. None of these is the “correct” zoom level in any absolute sense — they’re different lenses on the same underlying story, and the real mistake isn’t picking the wrong one, it’s forgetting which one you’re currently looking through.

Putting It Together: A Simple Framework for Reading Any Candlestick Chart

Once the individual pieces are familiar, applying candlestick chart basics to an actual chart in real time comes down to running through a short, repeatable sequence rather than hunting for a pattern in isolation:

First, establish the broader trend context before looking at any single candle — is the stock or index in an uptrend, downtrend, or a range? A pattern means something different depending on which of these it appears inside.

Second, read the candle itself — body size, wick length, and colour — the way this guide’s early sections describe.

Third, check whether it matches a recognised pattern name, but treat that as a prompt to look closer, not a conclusion.

Fourth, apply the Half-Body Hold Rule to the next candle before treating the signal as confirmed.

Fifth, cross-check against round numbers and recent volume — both can reinforce or undercut what the candle appears to be saying.

Sixth, make sure the timeframe you’re reading matches the timeframe you actually intend to trade.

Seventh — and this is the step beginners skip most often — size your position for the fact that you’re dealing with a probability, not a certainty, no matter how clean the setup looks.

A Worked Example: Putting Candlestick Chart Basics Into Practice

Frameworks are easier to trust once you’ve seen them applied together rather than described in isolation. Here’s a walk-through using a fully hypothetical stock — call it “Stock X” — to show how the pieces fit. None of the numbers below are real; they exist purely to demonstrate the sequence.

Stock X has been in a clear downtrend for three weeks, sliding from around ₹850 to ₹720. On a Thursday, it opens at ₹705, dips to an intraday low of ₹698, then rallies hard to close at ₹738 — a long lower wick, a solid bullish body, and volume roughly double its 20-day average. Read in isolation, that candle resembles a Hammer: a possible reversal signal after a decline.

Step one, trend context: the stock has been falling for weeks, so a reversal signal here at least makes contextual sense — this isn’t a random bullish candle appearing mid-range, where it would carry far less weight.

Steps two and three, reading the candle and naming the pattern: long lower wick, small real body near the top of the range, closing well above the open — a textbook Hammer shape, appearing exactly where Hammers are supposed to appear, after a decline.

Step four, the Half-Body Hold Rule: the real body runs from roughly ₹705 to ₹738, so the halfway mark sits near ₹721.50. The next day, Stock X opens at ₹740, dips to ₹725, and closes at ₹748. The close stays comfortably above ₹721.50 — the move held.

Step five, round numbers and volume: ₹700 sat just below the recent low, acting as a round-number floor the stock bounced off rather than breaking. Volume on the signal day was roughly double the 20-day average — real participation, not a thin, easily reversed move.

Step six, timeframe: this is a daily chart, and the scenario assumes a positional holding period of a few weeks — the signal and its confirmation are being read on a timeframe that actually matches the intended trade.

Step seven, sizing for probability: even with every box checked, this remains a probability read, not a certainty. A trader following this framework would size the position accordingly — meaningful enough to matter, small enough that being wrong doesn’t do lasting damage — and would define upfront where the idea is invalidated, for instance a daily close back below the ₹698 low.

Notice what this walk-through doesn’t do: it doesn’t promise the stock goes on to make new highs. It simply shows a structured way to move from “this candle looks interesting” to “here’s specifically what would need to be true for me to trust it, and here’s where I’d be proven wrong” — which is the actual, unglamorous work behind good candlestick chart basics.

Common Mistakes Beginners Make When Reading Candlestick Charts

A few mistakes show up more often than any other. Treating a single candle in isolation, without any trend context, is probably the most common — the exact same Hammer means something different at the bottom of a multi-week decline than it does in the middle of a sideways range. Memorising pattern shapes without ever checking whether the next candle actually held is another — this is exactly what the Half-Body Hold Rule is meant to catch. Ignoring volume is a third: a technically “perfect” pattern on unusually thin volume deserves real scepticism. And chasing a candle after it has already fully played out — buying well after a big bullish candle has closed, hoping the momentum simply continues in a straight line — tends to be one of the more expensive habits a beginner can pick up, since it usually means paying up right as the move that already happened runs out of room.

Two more round out the list. Ignoring the broader index or sector when reading an individual stock’s candle is one — a bullish reversal candle means less when the entire sector is falling apart around it on the same day. And dismissing a Doji or small-bodied candle as “nothing happening” is another; a Doji after a strong trend is often more informative than an ordinary trending candle, precisely because it signals that the side previously in control has, at least momentarily, lost its grip.

How to Practice Without Risking Real Money

The fastest way to internalise all of this is repetition against real charts, without real capital on the line while you’re still building the habit. Paper trading — tracking hypothetical trades on live prices without placing real orders — is available on most Indian broker platforms, including Zerodha, Fyers, and Upstox, as well as on charting tools like TradingView. Pick two or three stocks you already know reasonably well, and spend a few weeks simply narrating what you see: this candle’s body sits at roughly the halfway mark of yesterday’s range, on volume that looks about average for this name. Then go back and check what happened next.

This is also the right setting to test the Half-Body Hold Rule and the Snapback-Resume Range for yourself, on the specific instruments you actually plan to trade, rather than taking either on faith from this article.

A simple journal helps more than most beginners expect. For each observation, note the date, the stock, the pattern or setup you thought you saw, whether the Half-Body Hold Rule confirmed it, what volume looked like, and what actually happened over the following few sessions. After thirty or forty entries, real patterns in your own reading — not generic ones from a textbook — tend to emerge: which setups you read well, which you consistently misjudge, and which stocks you’ve genuinely come to understand.

Build Your Own Checklist for Candlestick Chart Basics

A short, personal checklist beats a long memorised list of pattern names. A reasonable starting version looks like this:

  • What’s the broader trend right now — up, down, or range-bound?
  • What does this candle’s body and wicks actually show, in plain language?
  • Does it match a recognised pattern — and if so, which one?
  • Did the next candle hold above (or below) the halfway mark of this candle’s body?
  • Is volume unusually high, unusually low, or roughly average for this stock?
  • Is there a round number nearby that could be doing some of the work?
  • Does my timeframe match how long I actually intend to hold this position?
  • Am I sizing this as a probability, not a certainty?

Print it, save it, or rebuild it in your own words — the version you actually use consistently will always beat a more sophisticated one you don’t.

Frequently Asked Questions

What is a candlestick chart in simple terms?

It’s a way of showing a stock or index’s price using individual “candles,” each built from four numbers — the open, high, low, and close for a chosen period. The candle’s colour shows whether the close was above or below the open, and its shape shows how much price moved around before settling there. Once that’s second nature, you’ve covered the core of candlestick chart basics — everything else in this guide builds outward from it.

Is candlestick pattern trading reliable?

Not on its own, and not with certainty. Candlestick patterns are probability tools, not guarantees — the same pattern behaves differently across different stocks, timeframes, and market conditions. Most experienced traders use candles alongside trend context, volume, and support and resistance rather than as a standalone strategy. Combining a pattern with the Half-Body Hold Rule and a volume check, both described earlier in this guide, tends to filter out a meaningful share of the weaker, unconfirmed signals.

Can I lose money relying on candlestick patterns?

Yes. No pattern, framework, or heuristic described in this guide — including the Half-Body Hold Rule and the Snapback-Resume Range — removes the risk of loss. Treat candlestick reading as one input among several, size positions accordingly, and never risk more than you can afford to lose.

What is the difference between a bullish and a bearish candle?

A bullish candle closes above where it opened, usually shown in green or white. A bearish candle closes below where it opened, usually shown in red or black. That’s the entire distinction for a single candle — everything else is built from the context around it.

Doji vs Hammer — which is more reliable?

Neither is inherently more reliable in isolation — they signal different things. A Doji signals indecision between buyers and sellers. A Hammer signals a potential reversal after a decline, provided the next candle holds above roughly half of its body. Reliability, for both, depends heavily on the specific stock, trend context, and volume around them, not the pattern name alone.

How many candles should I analyse before making a decision?

There’s no fixed number that applies everywhere, but a single candle in isolation is rarely enough. A reasonable habit is to check the last 10 to 20 candles on your chosen timeframe for trend context, then narrow in on the most recent two or three for the specific signal and its confirmation. Zooming out further — 50 to 100 candles — is also worth doing occasionally, just to check that the shorter-term trend you’re reading actually agrees with the bigger picture.

What is the best timeframe for reading candlestick charts?

It depends entirely on how long you intend to hold the position. Intraday traders typically read 1-minute to 15-minute candles. Positional and swing traders typically read daily or weekly candles. Reading a timeframe that doesn’t match your actual holding period is one of the more common mistakes beginners make.

Do candlestick patterns work the same way on Indian stocks as on US stocks?

The underlying mechanics — open, high, low, close, and the psychology behind them — are the same everywhere candlestick charting is used. What differs are structural details: trading hours, circuit limits, typical volume patterns, and round-number behaviour tied to India-specific instruments like Nifty and Bank Nifty options.

What’s the single most important thing to check before trusting a candlestick signal?

Context. The exact same candle can mean completely different things depending on the prevailing trend, the instrument’s typical volume, and where price sits relative to recent round numbers. Beginners tend to focus on memorising what a candle looks like; more experienced readers focus on where it’s showing up.

Where to Go From Here

If you take one thing from this guide, make it this: open a chart today, pick one stock you already know, and spend fifteen minutes simply narrating the last twenty candles out loud — what the body and wicks show, whether the next candle held, what volume looked like. Do that for two weeks before you let any of it influence a real trade. That’s really what candlestick chart basics comes down to in practice — repetition against real charts, not one more memorised pattern name.