
By mid-2026, both gold and Indian equities had delivered remarkable multi-year runs, and headlines were framing the choice between them as a contest with a single winner. That framing misses something more useful: gold and equity have historically done fundamentally different jobs in a portfolio, and the more productive question usually isn’t which one wins, but what role you actually need each one to play.
| QUICK DEFINITION Gold, as an investment, is a physical commodity and store of value with no earnings, dividends, or interest of its own — its return comes entirely from price appreciation, plus whatever hedge value it provides against inflation or market stress. Equity is an ownership stake in a company’s future earnings, offering the potential for capital appreciation, dividends, and long-term growth tied directly to business and economic performance. This article compares both for Indian investors using historical data; it does not recommend allocating to either. |
Table of Contents
Why “gold vs equity” is usually the wrong framing
Comparison articles often present gold and equity as competing bets, implying a reader should pick one. In practice, most financial planners treat them as complementary building blocks rather than substitutes — each doing a different job within the same portfolio, not competing for the same role.
The “versus” framing tends to dominate headlines specifically because it’s a more engaging way to write about markets, not because it reflects how portfolios are typically built in practice. A more accurate framing asks how much of each, not which one exclusively.
This article uses the versus framing in its title because that’s the comparison readers are actually searching for, but it’s worth being upfront that the more useful output of this comparison is a decision framework, not a verdict declaring one asset class superior.
None of the historical data or forecasts discussed below should be read as a recommendation to buy, sell, or hold any specific amount of either asset class. They’re presented so you can reason about the comparison with real, sourced numbers instead of vague impressions.
Readers who came here for a single confident verdict may find that unsatisfying, but a false verdict would be a worse outcome than an honest, data-backed framework — especially for a decision involving real money and a genuinely personal set of circumstances this article can’t see.
What equity actually is as an asset class
Buying equity means buying a fractional ownership stake in a real business — a claim on its future profits, whether distributed as dividends or retained and reinvested to grow the company further. Its long-run return potential is tied directly to corporate earnings growth and, more broadly, economic expansion.
This ownership structure is also why equity carries business-specific risk that gold simply doesn’t: a company can be poorly managed, lose market share, or fail outright, in ways that have no equivalent for a commodity like gold, which doesn’t depend on any single entity’s decisions or execution.
Broad equity exposure — through an index fund tracking the Nifty 50 or a similar benchmark, for instance — diversifies away much of that single-company risk while retaining exposure to overall economic and corporate earnings growth, which is one reason index-based equity investing has grown so popular among first-time Indian investors.
Equity returns are also considerably more volatile in the short-to-medium term than many first-time investors expect going in, which matters enormously for how any equity allocation should be sized relative to a genuinely short time horizon or an imminent cash need.
It’s also worth distinguishing individual stock-picking from broad, diversified equity exposure throughout this comparison — the volatility and risk characteristics discussed here describe equity as an asset class broadly, and a concentrated bet on a handful of individual stocks generally carries meaningfully higher risk than a diversified index does.
What gold actually is as an asset class
Gold generates no income of its own — no dividend, no interest, no earnings call. Every rupee of historical gold return has come from someone else being willing to pay more for the same ounce later than you paid for it, whether driven by inflation expectations, currency movements, central bank buying, or a flight to safety during market stress.
This absence of yield is often framed as a weakness, and in a narrow sense it is — gold can’t compound the way a reinvested dividend or retained corporate earnings can. But it’s also precisely why gold behaves differently from equity during periods when investors are fleeing risk broadly, which is the property most often cited in its favour.
In India specifically, gold carries an additional cultural and practical dimension beyond pure investment theory — it’s widely held as jewellery, gifted at weddings, and treated as a store of family wealth passed across generations, which shapes demand patterns differently than in markets where gold is held almost exclusively as a financial instrument.
Gold prices in India are also influenced by factors with no equity parallel: import duties, the rupee’s exchange rate against the US dollar, since gold is priced internationally in dollars, and domestic jewellery demand around specific festival and wedding seasons.
None of gold’s cultural role changes its financial characteristics — jewellery specifically also carries making charges and purity considerations that reduce its efficiency as a pure investment vehicle compared with gold held via an ETF, fund, or digital gold account instead.
The Uncorrelated Ballast
ORIGINAL FINQUESTA CONCEPT — The Uncorrelated Ballast describes gold’s most defensible portfolio role: not as a higher-returning bet than equity, but as an asset that has historically tended to move differently from equity, particularly during market stress. A ballast doesn’t make a ship faster — it makes it more stable in rough water. Held in modest proportion alongside equity, an imperfectly correlated asset can reduce a portfolio’s overall swings even without outperforming on its own.
This is a mathematical property of combining assets that don’t move in lockstep, not a claim that gold is a superior investment. A blend of two imperfectly correlated assets can have a smoother ride than either held alone, even when one of them has a lower expected long-run return by itself.
The ballast framing also explains why financial planners generally discuss gold in terms of a modest allocation percentage, not as a primary wealth-building engine — its historical job in a portfolio has been stability during stress, not primary growth, even in periods like the recent run when its returns have outpaced equity.
It’s worth being precise that correlation isn’t fixed forever — the relationship between gold and equity can shift across different market regimes, and a pattern that held during two specific historical crises isn’t a law of markets guaranteed to repeat in every future downturn.
This is also why financial advisors caution against evaluating gold purely on the years when equity performed well — the two assets aren’t meant to be judged on the same annual scorecard, since their intended jobs within a portfolio are different from the outset.
This is also a genuinely different claim from saying gold “always goes up when stocks go down” — it doesn’t, reliably, in every single instance. The more defensible claim is a tendency, observed across multiple historical episodes, not a mechanical, guaranteed inverse relationship.
Long-run historical returns: what the data actually shows
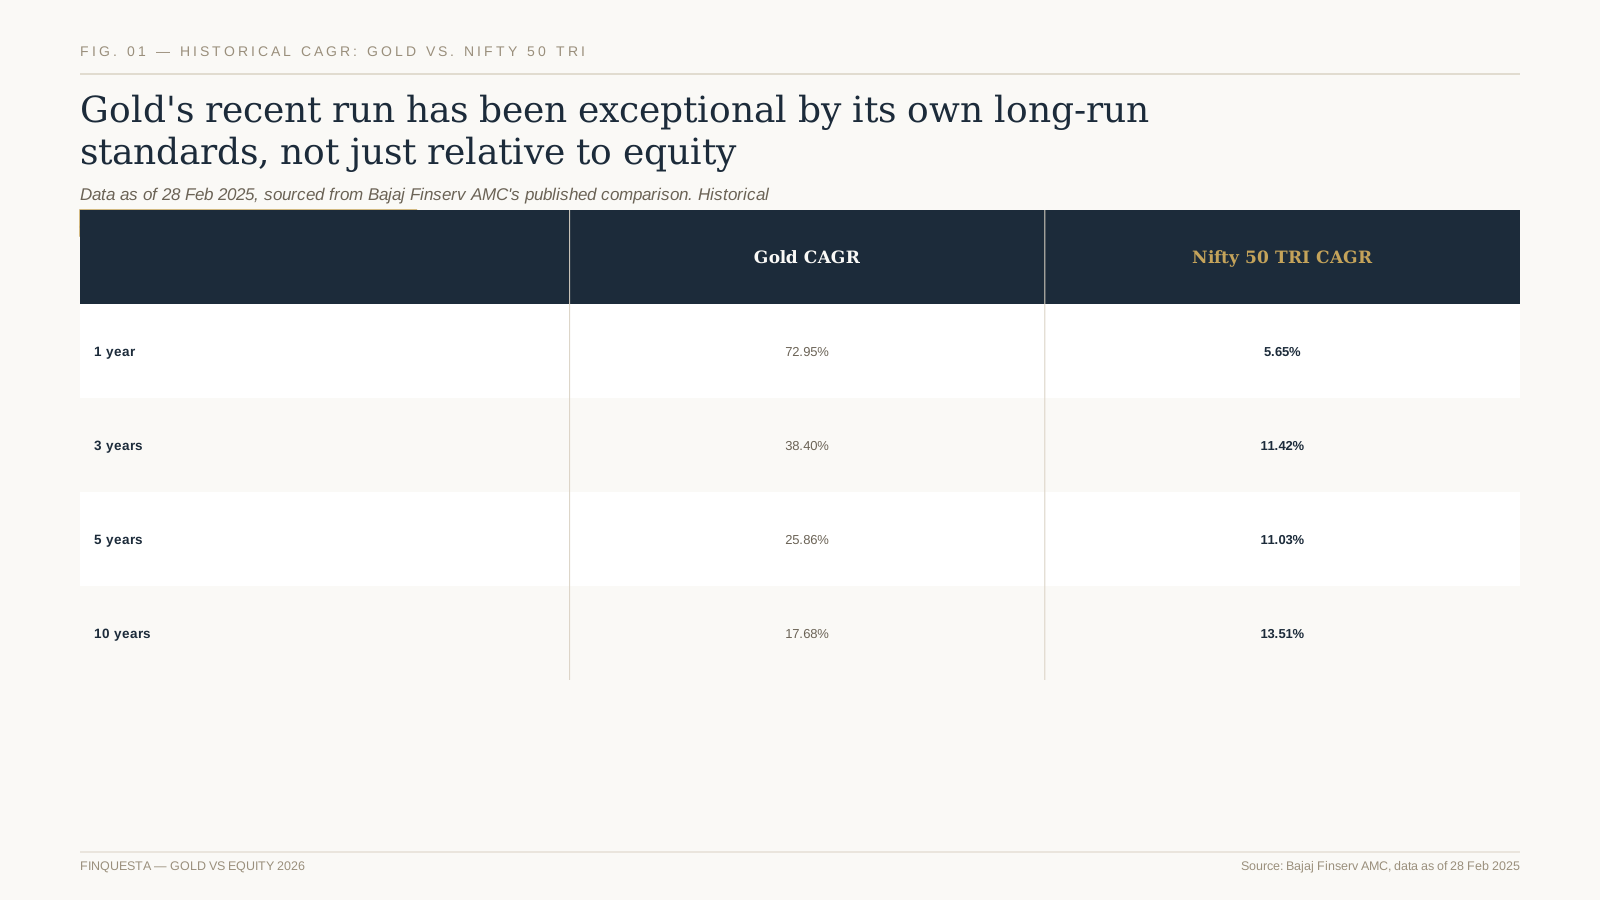
Fig. 01 — Gold’s 1-year and 3-year CAGR sharply outpaced Nifty 50 TRI as of February 2025
According to a published comparison from Bajaj Finserv Asset Management, as of 28 February 2025, gold’s compound annual growth rate ran well ahead of the Nifty 50 Total Return Index across the 1-year (72.95% vs. 5.65%), 3-year (38.40% vs. 11.42%), and 5-year (25.86% vs. 11.03%) windows, with the 10-year figures closer together (17.68% vs. 13.51%).
A separate comparison covering 2004 to 2024 put gold’s 20-year CAGR at roughly 13.8%, its 10-year CAGR at roughly 11.07%, and its 5-year CAGR (2019-2024) at roughly 17.2% — figures that broadly agree with the first source’s direction and magnitude while differing somewhat in specifics, entirely explainable by the different end dates each calculation uses.
The headline takeaway isn’t that gold has permanently overtaken equity as the higher-returning asset — it’s that gold’s most recent multi-year run has been exceptional by its own long-run historical standards, not only relative to equity. Extrapolating a recent exceptional run indefinitely forward is a common, well-documented forecasting mistake, for either asset class.
It’s also worth noting that CAGR figures compound smoothly by definition, which can understate how bumpy the actual year-to-year path was for either asset — a 10-year CAGR of 13-17% doesn’t mean returns arrived in a steady, predictable annual instalment along the way.
Why the numbers shift depending on the exact end date
Both data points above cover genuinely overlapping periods yet produce different precise figures, which isn’t a contradiction — it’s a direct consequence of measuring CAGR from a different start and end date. A single strong or weak month at either end of a window can meaningfully shift a multi-year annualised figure.
This is a useful general lesson about any CAGR-style statistic in financial content, including this article’s own numbers: always check which exact dates a figure covers before treating it as a stable, universal truth, since a 10-year CAGR calculated today and the same-length window calculated a year from now can differ meaningfully.
It’s also why this article cites its specific sources and as-of dates explicitly for every historical figure, rather than presenting round numbers without attribution — a reader should be able to trace any claim back to when and how it was actually calculated.
The lesson generalises well beyond gold and equity: any time two sources cite seemingly conflicting statistics about the same underlying trend, checking the measurement window before assuming one source is simply wrong is usually the more productive next step.
How each behaved during past crises
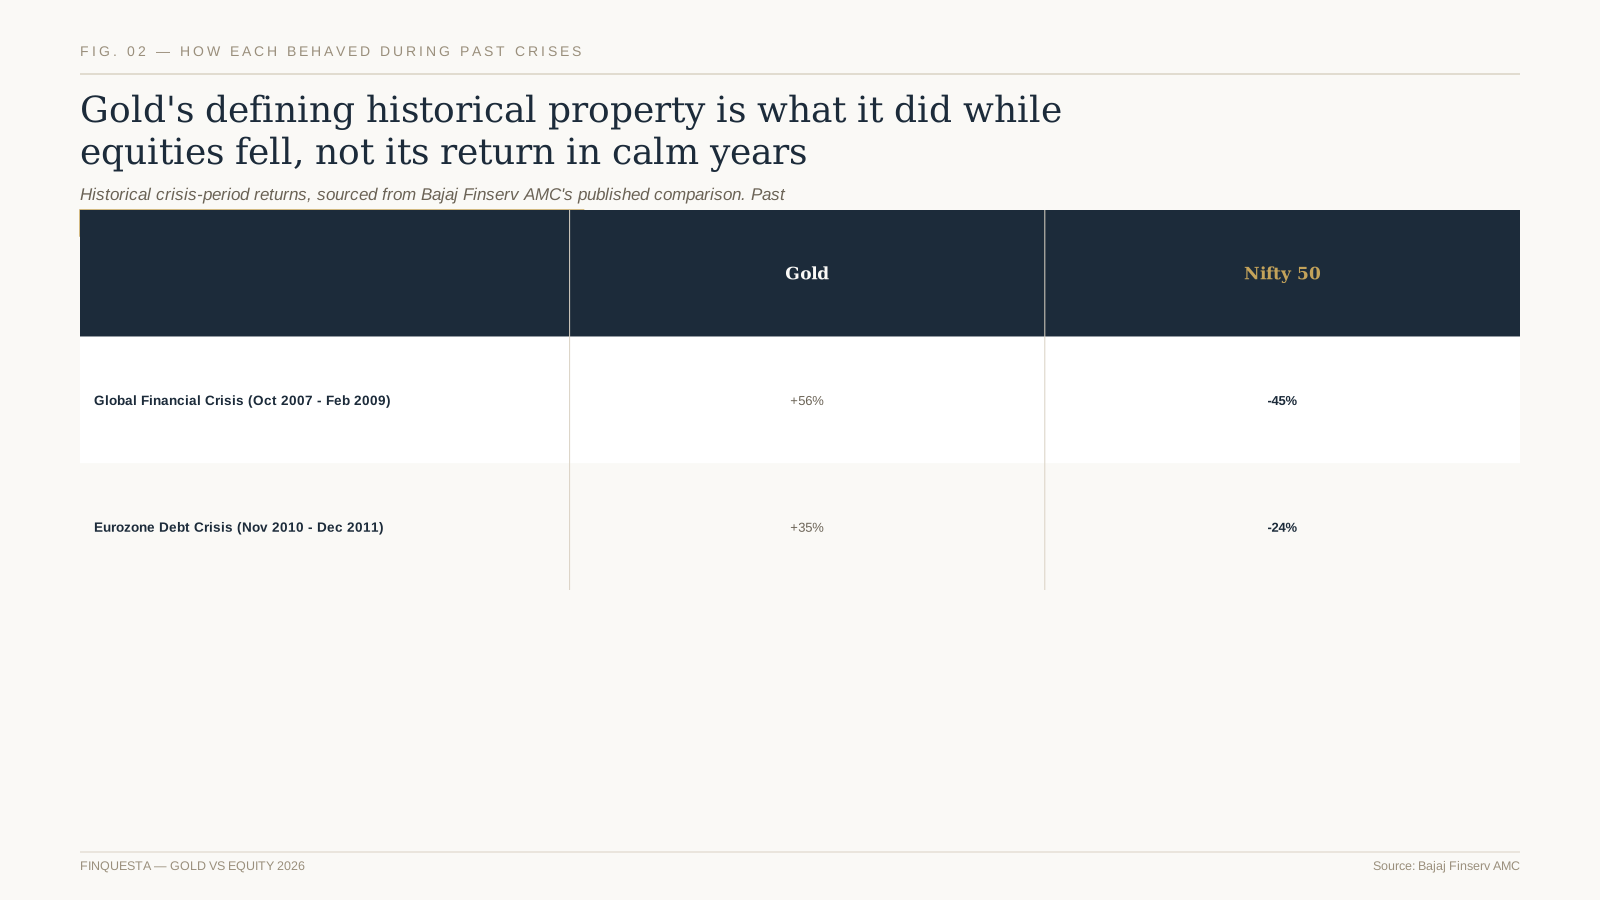
Fig. 02 — Gold rose while equities fell during both the Global Financial Crisis and the Eurozone Debt Crisis
During the Global Financial Crisis (October 2007 to February 2009), gold reportedly delivered a 56% gain while the Nifty 50 declined by 45% over the same window. During the Eurozone Debt Crisis (November 2010 to December 2011), gold gained roughly 35% while the Nifty 50 fell around 24%, according to the same published comparison.
These two episodes are the historical basis for gold’s reputation as a crisis hedge, and they’re genuinely striking — but two data points, however dramatic, are not a statistically large sample. Other stress periods in market history have seen gold and equity move less dramatically apart, or occasionally even fall together for a stretch before diverging.
The honest reading is that gold has a real, historically-documented tendency to hold up better than equity during acute financial stress — not an ironclad guarantee that repeats identically in every future downturn, in every economic environment, for every conceivable type of crisis.
Both cited crisis windows also happened before India’s most recent decade of retail investing growth and before several structural changes to how Indian markets and gold-holding vehicles operate — another reason to treat them as informative history rather than a precise, repeatable template.
The Forecast Illusion
ORIGINAL FINQUESTA CONCEPT — The Forecast Illusion describes the false sense of precision created by a single specific price target — Nifty at 32,032, gold at Rs 1.5 lakh — when the forecasting institution’s own methodology typically reveals much wider genuine uncertainty underneath that headline number. A single number feels more actionable than a range, which is exactly why headlines favour it, even when the analysts producing the forecast explicitly built a range into their own work.
In October 2025, Axis Securities published a gold outlook suggesting accumulation on dips in the Rs 1.05-1.15 lakh per 10-gram range, with a potential target of Rs 1.45-1.50 lakh by Diwali 2026 — up to roughly 30% further upside from the levels referenced in that report.
In December 2025, Kotak Securities published a Nifty 50 outlook for December 2026 with three distinct scenarios: a bull case of 32,032 (24% upside), a base case of 29,120 (13% upside), and a bear case of 26,208 (roughly 1.5% upside) — a genuinely wide range that the single “32,032” headline figure, quoted alone, doesn’t convey.
Both forecasts are single firms’ published opinions, not certainties, and both are explicitly time-stamped here so a reader checking this article later can judge how they actually played out. Neither forecast is a Finquesta recommendation, and both should be weighed alongside other analysts’ views rather than treated as consensus.
A genuinely useful habit, when encountering any single price target in financial media, is asking whether the source has published the fuller range behind that headline number, as Kotak Securities did here — the range itself often tells you more about real uncertainty than the single most-quoted figure does.
It’s also worth remembering that both Axis Securities and Kotak Securities are reputable institutions publishing methodologically grounded views — the point isn’t that their forecasts are poorly researched, it’s that even well-researched forecasts carry genuine uncertainty that a single headline figure obscures.
Volatility and risk profile compared
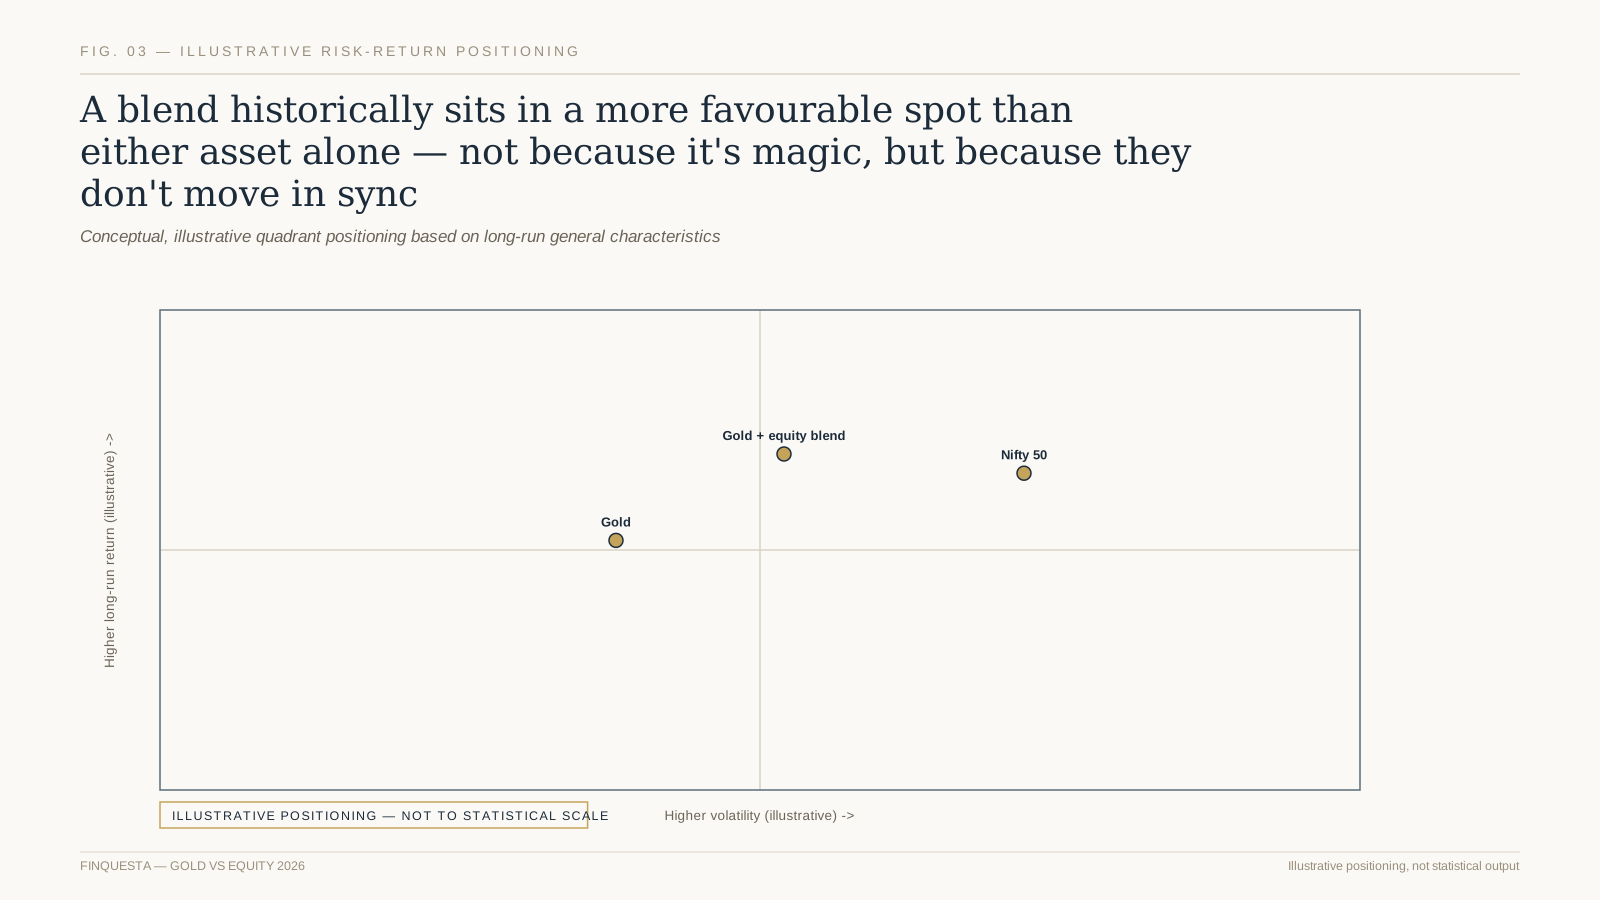
Fig. 03 — A gold-equity blend has historically occupied a more favourable risk position than either asset alone
Equity is generally understood to carry higher volatility than gold over short-to-medium horizons, driven by company-specific news, sector rotation, macroeconomic data, and broad sentiment shifts that can move prices meaningfully within a single trading session.
Gold is generally described as comparatively less volatile, though “less volatile” doesn’t mean stable — gold prices can and do move sharply over weeks or months, as its own exceptional 1-year return figure above demonstrates. Lower relative volatility compared to equity is not the same as low absolute volatility.
Combining the two in a single portfolio, rather than choosing exclusively, is the practical expression of the Uncorrelated Ballast idea: the blended outcome historically hasn’t simply averaged the two assets’ volatility, because their imperfect correlation means they don’t always have their worst days at the same time.
None of this changes with a catchy chart — the illustrative positioning in the figure above is meant to build intuition for why blending matters, not to substitute for an investor’s own risk assessment based on their actual portfolio and goals.
Taxation: a general framework, not current rates
Gold and equity are taxed differently in India, and the specific holding periods and rates that separate short-term from long-term capital gains treatment for each have changed more than once in recent years through Union Budget announcements. This article deliberately does not state specific current percentage rates or holding-period thresholds.
Physical gold, gold ETFs, and equity have historically been taxed under different specific rules from one another, and even different gold-holding vehicles — physical, ETF, or the now-discontinued Sovereign Gold Bonds — have carried meaningfully different tax treatment from each other, particularly around bond maturity versus early sale.
Because tax rules genuinely change and because an individual’s own tax situation varies by income slab and holding structure, confirm current capital gains rules for both asset classes directly with the Income Tax Department’s published guidance or a qualified tax professional before making any decision that depends on the after-tax outcome.
This deliberate omission of specific rates is itself a compliance choice worth understanding: tax figures are exactly the kind of detail that ages fastest in financial content, and a wrong specific number is more actively misleading than a general pointer toward checking current rules directly.
This general framework applies regardless of whether gold or equity gains ultimately end up taxed at similar or different rates in a given year — the point of this section is the structure of the comparison, not a specific figure that would need updating with every budget cycle.
Vehicles: how you’d actually hold each one
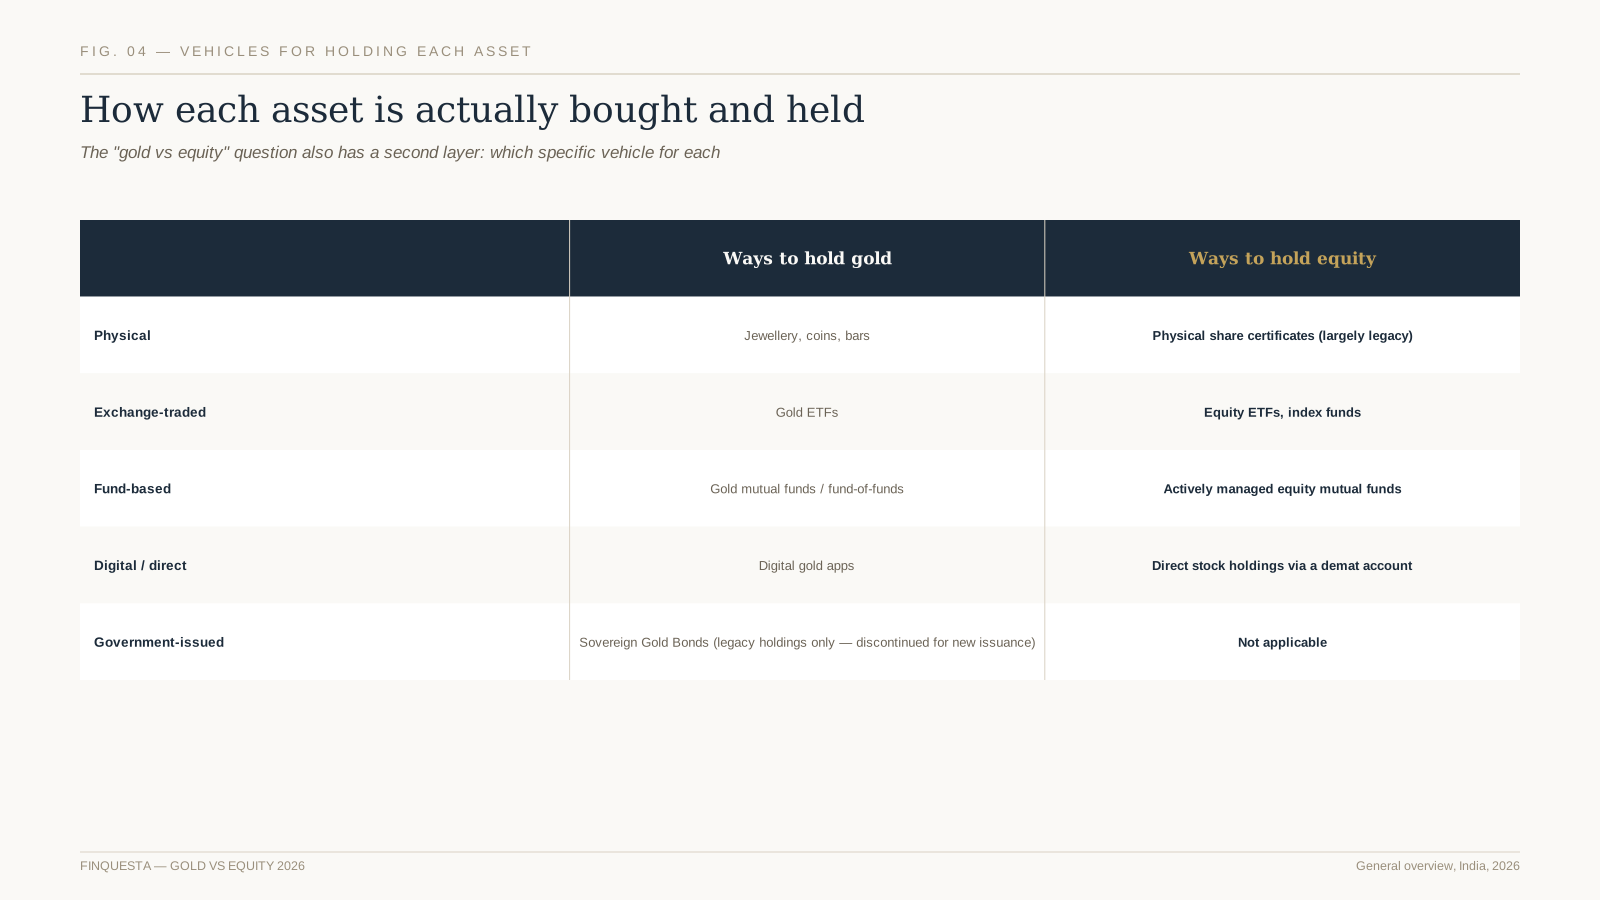
Fig. 04 — Physical, exchange-traded, fund-based, and digital options exist on both sides of the comparison
Physical gold — jewellery, coins, and bars — carries making charges, storage and security considerations, and purity-verification concerns that have no real equity equivalent. Equity’s closest historical analogue, physical share certificates, is now largely a legacy format, since Indian equity is overwhelmingly held electronically through a demat account today.
Gold ETFs and gold mutual funds let investors gain price exposure to gold without physically storing it, similar in spirit to how an equity index fund or ETF provides diversified exposure without personally selecting individual stocks — both trade the specific-selection burden for a simpler, pooled structure.
Digital gold apps, offered by several Indian fintech platforms, allow buying fractional gold quantities online, redeemable in some cases for physical delivery — a genuinely modern vehicle without a precise equity parallel, since equity has been electronic and fractional-friendly for considerably longer already.
Costs also differ meaningfully within each category — one gold ETF’s expense ratio and tracking accuracy against physical gold prices can differ from another’s, in the same way that two index funds tracking the same benchmark can have different expense ratios worth comparing before choosing either.
Investors should also check whether a specific gold ETF or fund is available for lump-sum investment, systematic investment, or both — mechanics that mirror the same SIP-versus-lump-sum choice equity mutual fund investors are likely already familiar with from the equity side.
The now-discontinued Sovereign Gold Bond, and what changed
Sovereign Gold Bonds, issued by the Reserve Bank of India on the government’s behalf, were once a popular gold-exposure vehicle specifically because they offered a small additional annual interest payment on top of gold’s own price movement — a yield feature no other common gold vehicle provided.
New SGB issuance has since been discontinued, according to multiple current sources, including affected banks’ own updated product pages. Investors who already hold SGBs from earlier tranches continue to hold them through to maturity or an eligible premature redemption window, but no new tranches are being issued for fresh investors to buy into.
This is a meaningful, relatively recent shift for anyone researching gold investment options using older articles or outdated guides — content describing SGBs as a currently available, actively-issued option is describing a vehicle that, as of 2026, no longer accepts new subscriptions.
For investors who specifically valued the SGB’s small additional interest payment, no fully identical replacement currently exists among gold ETFs, gold mutual funds, or digital gold — each of those alternatives offers pure price exposure without an equivalent yield component.
What role each plays in a portfolio
Equity’s typical portfolio role is long-run growth: compounding ownership stakes in productive businesses over years or decades, with the expectation — not the guarantee — that economic and corporate earnings growth translates into higher share prices and dividends over time.
Gold’s typical portfolio role is stability and diversification: a smaller allocation intended to reduce overall portfolio swings and provide a partial hedge during specific kinds of market stress, rather than to serve as the primary engine of long-run wealth building.
Neither role is inherently more important than the other — they answer different questions. Equity answers “how do I grow this money over decades,” while gold more often answers “how do I make this portfolio hurt less during a bad few years,” and most complete financial plans need answers to both questions, not just one.
Recognising that both questions matter simultaneously, rather than picking one and ignoring the other, is a large part of what separates a genuinely considered asset allocation from simply chasing whichever asset class is currently dominating the headlines.
This division of labour also shows up in how each is discussed by professionals — equity research focuses heavily on growth prospects and valuation, while gold commentary focuses more on macro conditions, currency, and safe-haven demand, reflecting the different questions each asset is actually answering.
Commonly cited allocation ranges
Financial planning literature commonly cites gold allocations in a broad range, often somewhere between roughly 5% and 15% of a portfolio, as a starting reference point for the ballast role described earlier — though this range varies across sources and is explicitly a general starting reference, not a personalised recommendation for any individual reader.
The right figure for any individual depends on factors this article can’t know about a specific reader: existing asset mix, time horizon, other hedges already in place, income stability, and personal comfort with volatility — all of which a general article, by its nature, can’t weigh for you.
Treat any specific percentage you encounter, including ranges cited here, as a starting point for a conversation with a qualified financial planner about your own situation, not as a target to hit mechanically without further thought.
It’s also worth noting that these commonly cited ranges predate gold’s most recent exceptional run — a reasonable question worth discussing with a financial planner directly is whether a strong recent run changes the case for rebalancing back toward a target range, rather than letting an allocation drift upward on its own.
Common mistakes in the gold-vs-equity debate
The most common mistake is chasing whichever asset just had the better run, allocating heavily into gold after a strong gold year or heavily into equity after a strong equity year — a pattern that tends to buy in near a local peak rather than capturing the diversification benefit that comes from holding both consistently.
A second common mistake is treating a single historical statistic, like a specific CAGR or crisis-period return, as a guarantee of future behaviour, when both figures cited in this article are explicitly historical and explicitly time-stamped rather than forward projections.
A third is ignoring the vehicle-level differences entirely — assuming, for instance, that a Sovereign Gold Bond is still available for new purchase, or that a specific gold ETF’s expense ratio and tracking accuracy are identical across every provider, when both are the kind of practical detail that genuinely varies.
A fourth common mistake is comparing the two assets using different time windows without realising it — judging equity on a rough recent year while judging gold on a strong multi-year run produces a comparison that looks lopsided mostly because of the mismatched windows, not the assets themselves.
A fifth mistake is assuming this article’s own historical figures will look identical if recalculated a year from now — they won’t, and that’s expected, not a flaw in the analysis. Markets move, and any dated comparison like this one should be periodically refreshed against current data.
Liquidity and practical considerations
Equity held through a demat account, or gold held through an ETF or mutual fund, is generally straightforward to convert to cash within the standard settlement cycle of the exchange it trades on — a meaningfully different liquidity profile from physical gold, which requires finding a buyer or seller willing to transact at a fair price, potentially with making-charge losses on jewellery specifically.
Digital gold and gold ETFs sit closer to equity’s liquidity profile than physical gold does, which is worth weighing if quick access to the value of a holding matters more to your situation than the specific form gold takes.
Liquidity needs also interact directly with time horizon: money needed within the next year or two generally belongs in more liquid, lower-volatility instruments than either equity or gold, regardless of which of the two otherwise looks more appealing on a historical-return basis.
Selling physical jewellery specifically often involves a loss relative to the prevailing gold price, since making charges paid on purchase are rarely recovered in full on resale — a cost that doesn’t apply to gold held through an ETF, mutual fund, or digital gold account instead.
Equity liquidity can also tighten meaningfully during periods of extreme market stress — the same crisis periods discussed earlier — when trading volumes can drop and price discovery can become less orderly, a nuance worth remembering alongside gold’s own crisis-period behaviour.
Time horizon changes the comparison
Over multi-decade horizons, equity’s higher expected long-run return has historically had more time to compound and to recover from any single bad stretch, which is a large part of why long-horizon retirement portfolios are typically built with a meaningfully larger equity allocation than gold allocation.
Over shorter horizons, or for money with a specific near-term purpose, the higher short-term volatility of equity becomes a much bigger practical concern, since there’s less time available to ride out a downturn before the money is actually needed.
This is precisely why a single universal “gold vs equity” answer doesn’t really exist — the honest answer depends heavily on when the money is needed, which is a fact about the individual investor’s situation, not about which asset class is objectively better.
A useful practical habit is separating money by the goal it’s actually meant for, rather than applying one blanket gold-versus-equity decision across your entire net worth regardless of when each portion is genuinely needed.
A neutral decision framework
Rather than resolving “gold or equity” as a single verdict, the framework below reflects the order in which the considerations discussed in this article are generally worth working through for your own situation.
- Clarify the time horizon for the specific money in question — years to a goal, not just a general “long term.”
- Review what you already hold, since the comparison should be about your total portfolio, not each asset in isolation.
- Treat any specific price target or forecast, gold or equity, as one firm’s dated opinion, not a plan.
- Confirm current tax treatment for whichever vehicle you’re considering directly, rather than relying on a general article.
- Revisit the mix periodically rather than treating any initial allocation as permanent and unchangeable.
None of these five steps requires predicting which asset will perform better in 2026 specifically — that’s intentional, since that exact prediction is what this article has already shown even professional analysts openly disagree on within their own published bull, base, and bear scenarios.
| EDUCATION, NOT A RECOMMENDATION This article compares gold and equity using historical, sourced data for general education. It does not recommend allocating to either asset class, does not endorse any brokerage forecast cited, and is not personalised investment advice for any individual’s specific goals, tax situation, or risk tolerance. |
Gold vs equity: frequently asked questions
Is gold or equity a better investment in 2026?
Neither is universally better — they’ve historically played different roles, with equity generally offering higher long-run growth potential and gold generally offering lower correlation to equity during market stress. The right mix depends on your time horizon, existing holdings, and risk tolerance, not a single universal answer.
Has gold really outperformed the Nifty 50 recently?
According to a comparison published by Bajaj Finserv AMC using data as of 28 February 2025, gold’s 1-year, 3-year, and 5-year CAGR figures were well ahead of the Nifty 50 TRI over the same windows. This reflects an exceptional recent run for gold by its own historical standards, not a permanent reversal of each asset’s typical long-run role.
Can Sovereign Gold Bonds still be purchased in 2026?
No. New SGB issuance has been discontinued according to current bank and platform disclosures. Investors who already hold SGBs from earlier tranches continue holding them to maturity or an eligible early-redemption window, but new investors can no longer subscribe to fresh tranches.
Is gold a safe investment?
Gold carries less short-term volatility than equity in general, and has a historical tendency to hold up during certain market crises, but its price can still move sharply and it generates no income of its own. “Safe” is relative — gold still carries genuine price risk, just a different kind than equity.
What percentage of a portfolio should be in gold?
Financial planning literature commonly cites a broad range, often roughly 5% to 15%, as a general reference point — not a personalised recommendation. The right figure depends on your specific goals, time horizon, and existing portfolio, which a general article can’t assess for you.
Should I believe brokerage price targets for gold or Nifty in 2026?
Treat any single brokerage’s price target as one firm’s dated opinion rather than a certainty. Even firms publishing bullish targets, like Kotak Securities’ December 2025 Nifty outlook, typically include their own bull, base, and bear scenarios — a genuinely wide range that a single headline number doesn’t convey.
How is gold taxed compared to equity in India?
Gold and equity are taxed under different specific rules in India, and the exact holding periods and rates have changed through recent Union Budgets. Confirm current capital gains treatment for both asset classes directly with the Income Tax Department or a qualified tax professional rather than relying on a general estimate.
What’s the difference between digital gold and a gold ETF?
Digital gold is typically purchased through a fintech app and represents a claim on physical gold held by the provider, sometimes redeemable for physical delivery. A gold ETF trades on a stock exchange like a security, generally regulated under SEBI’s mutual fund and exchange-traded fund framework, with different cost and redemption mechanics.
Does gold protect against inflation?
Gold is commonly described as a partial inflation hedge over long periods, though the relationship isn’t precise or guaranteed year to year. It’s one of several reasons gold is cited for a diversification role, alongside its historical behaviour during market stress.
Can I lose money investing in gold?
Yes. Gold prices can and do decline, sometimes sharply and for extended periods, despite its reputation for relative stability compared to equity. No asset class discussed in this article is free of price risk.
Did gold or equity perform better during the 2008 financial crisis?
According to a published historical comparison, gold gained roughly 56% while the Nifty 50 fell roughly 45% during the Global Financial Crisis window of October 2007 to February 2009. This is one of the most frequently cited examples of gold’s historical crisis-hedge behaviour.
What replaced Sovereign Gold Bonds after they were discontinued?
No single vehicle fully replaces the SGB’s combination of price exposure plus a small additional interest payment. Investors seeking gold exposure now generally choose between physical gold, gold ETFs, gold mutual funds, or digital gold, each without an equivalent yield component.
Why did gold rise so much in the lead-up to 2026?
Multiple factors are typically cited for gold’s recent strength, including inflation concerns, currency movements, and central bank buying, though this article does not attempt to fully explain the causes — it focuses on documenting the resulting historical return figures with clear sourcing instead.
Disclaimer This article is for informational and educational purposes only and does not constitute financial, investment, tax, or legal advice. Figures, rates, and regulations mentioned are subject to change; please verify current details with official sources (RBI, SEBI, the Income Tax Department, IRS, or a licensed financial advisor) before making financial decisions. Finquesta may earn a commission from affiliate links in this article at no extra cost to you.