Emergency Fund: How Much You Actually Need [2026]

emergency fund
WHAT IS AN EMERGENCY FUND? An emergency fund is money kept in an easily accessible account, separate from everyday spending, meant to cover a genuine income loss or unavoidable expense without relying on debt. Anyone with recurring expenses needs one — salaried employees, freelancers, and business owners alike — though the right amount varies sharply between them. Most advisors suggest starting with a small buffer, then building toward three to six months of essential expenses. The money belongs in a liquid, low-risk account — a savings account, sweep-in fixed deposit, or liquid fund — not equities or anything that can lose value right when you need it.

Meera runs a freelance graphic design studio out of Bangalore. In a good month she bills somewhere between ₹70,000 and ₹1,20,000 — enough to live well, save a little, and not think too hard about the gap between her best month and her worst one. Then a long-standing client restructures its marketing budget, two other projects get shelved in the same week, and her income for the next quarter drops to almost nothing. She isn’t broke. She has investments, no debt, and a healthy credit score. What she doesn’t have is cash she can spend today without selling something or asking someone. That gap — between being financially fine on paper and being able to actually pay this month’s bills — is exactly what an emergency fund exists to close.

Ask most people how big that fund should be, and you’ll get the same answer everywhere: three to six months of expenses. It’s not wrong. It’s also not specific enough to be useful. A salaried employee with health insurance and a working spouse needs a different number than a freelancer with one big client. This piece exists to turn “three to six months” into an actual number for your situation, and to be honest about what that number should and shouldn’t include.

What the Numbers Say About Who’s Actually Prepared

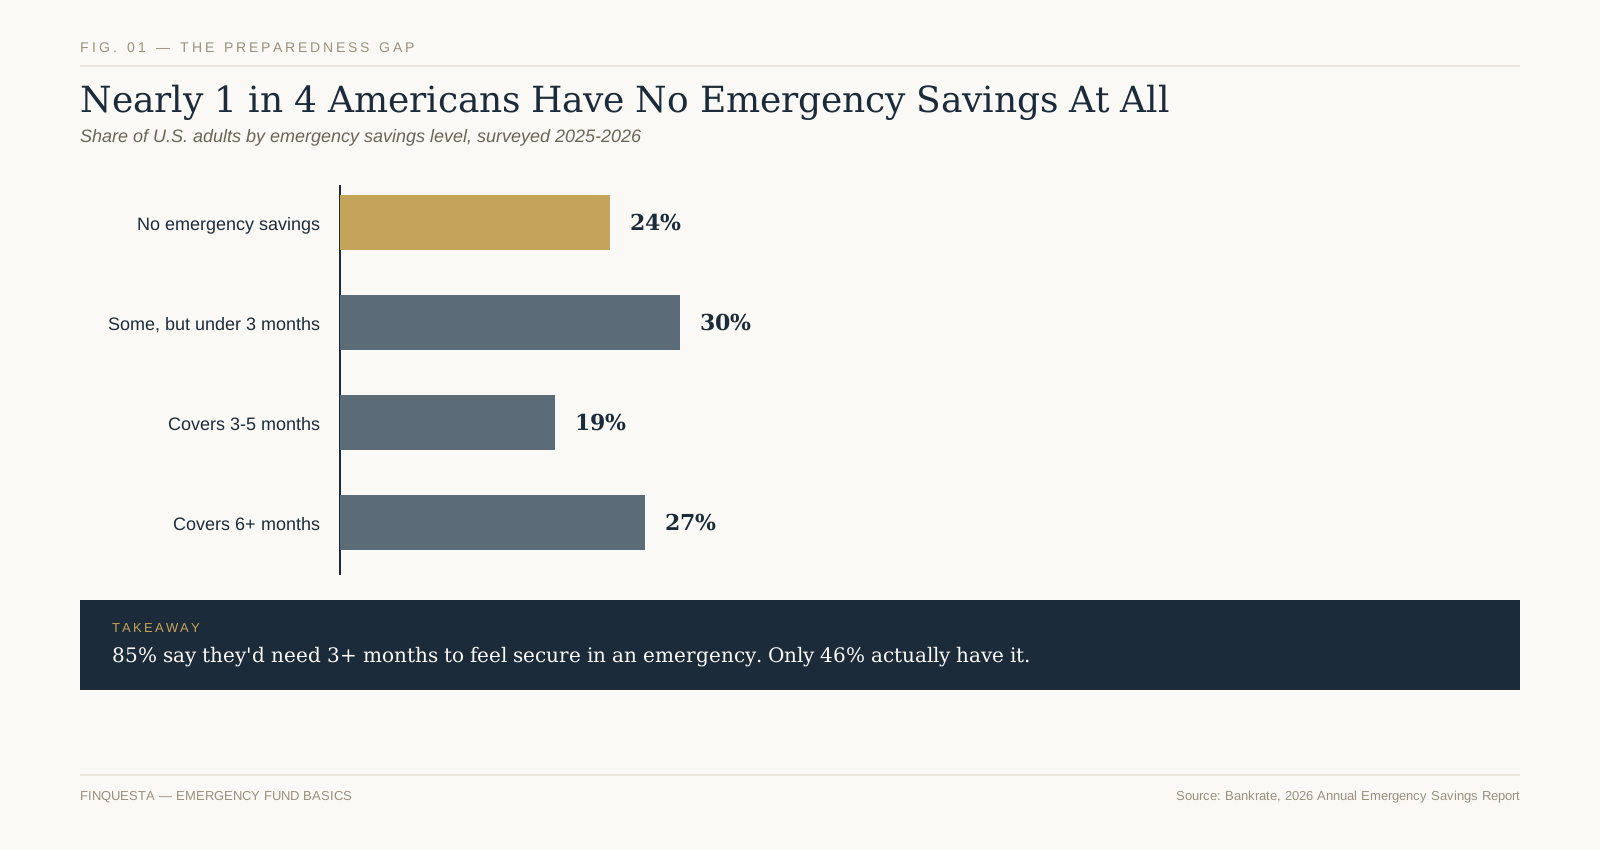
It’s worth pausing on the scale of the gap before getting into the framework, because it explains why this topic never stops being relevant. Bankrate’s 2026 Annual Emergency Savings Report, based on a national survey fielded in December 2025, found that only 47% of Americans said they had enough liquidity to cover a $1,000 emergency expense (source: Bankrate, “Bankrate’s 2026 Annual Emergency Savings Report,” bankrate.com, published February 4, 2026). Nearly a quarter of respondents — 24% — reported having no emergency savings at all, and only 46% had enough to cover even three months of expenses, despite 85% saying they’d need at least that much to feel comfortable.
emergency fund

FIG. 01 — The Preparedness Gap

The US Federal Reserve’s Survey of Household Economics and Decisionmaking, covering 2025 and published in May 2026, tells a similar story from a different angle: 63% of adults said they could cover a $400 surprise expense using cash or its equivalent, and 55% had specifically set aside enough to cover three months of an income loss (source: Board of Governors of the Federal Reserve System, “Report on the Economic Well-Being of U.S. Households in 2025,” federalreserve.gov, May 2026).

Both figures were essentially unchanged from the year before — this isn’t a one-year blip, it’s a persistent, structural gap between the standard advice and what people actually have set aside.

The picture looks similar in India, if less thoroughly surveyed. A 2025 survey of 1,720 users by Indian savings platform Stable Money found that nearly half — 47.4% — had saved less than a tenth of the emergency fund they’d calculated they needed (source: Stable Money, “Emergency Fund Gap” case study, stablemoney.in, 2025).

None of this means the three-to-six-month guidance is wrong. It means most people never arrive at a number that feels both correct and achievable enough to actually hit — and that’s the gap this article is built to close.

What Actually Counts as an Emergency (and What Doesn’t)

Before sizing the emergency fund, it’s worth being precise about what it’s for, because it only works if it’s protected from everyday scope creep. A genuine emergency has three features: it’s unplanned, it’s necessary, and delaying it would cost you more than paying for it now. A job loss fits. A medical bill fits. A car or bike repair that’s the difference between getting to work and not fits. A wedding gift, a flash sale, a trip that came up, or a phone upgrade do not — however real the desire to spend on them might feel in the moment.

This distinction matters because Bankrate’s same 2026 survey found that among people who’d tapped their emergency savings in the past year, 80% used it for essentials — an unplanned bill, monthly rent or utilities, or day-to-day costs — while a smaller share, under one in five, used it for non-essentials like a vacation or discretionary shopping. The fund holds up as a safety net precisely because most people, most of the time, use it the way it’s designed to be used. The moment it becomes a backup shopping budget, the number you calculate below stops meaning anything.

A useful gut check: if you can delay the expense a month without real consequence, it’s not an emergency yet — it’s a decision. If delaying it creates a cascading cost (a late fee, a missed diagnosis, a lost client), it qualifies.

Two edge cases that often get miscategorized in both directions: an annual insurance premium is not an emergency, even though it’s large and arrives once a year, because it’s entirely predictable and belongs in the regular budget instead. A sudden, necessary vet bill or a family member’s urgent medical cost, on the other hand, usually is one, even though nobody would have listed it as a line item in advance.

Why “Three to Six Months” Isn’t Wrong — Just Incomplete

Nearly every bank, robo-advisor, and finance blog converges on the same range, and for good reason: three to six months of expenses covers the length of a typical job search for a stable, in-demand role, without being so large that building it feels pointless. The trouble is that the range hides two very different numbers inside it, and almost nobody tells you which end applies to you.

The rule also tends to get applied to the wrong base number. Several major sources — Chase, Ally, and Fidelity among them — are careful to specify that the multiplier should apply to essential expenses, not your full salary or current lifestyle spending. That’s the right instinct, but “essential” is still a fairly blunt cut. Rent counts as essential, obviously — but does your full grocery budget count the same way a bare-bones one would? Does your gym membership? Most calculators don’t go far enough to answer that, which is where the next two sections come in.

The Stability Score: A Faster Way to Size Your Emergency Fund

Original Finquesta framework

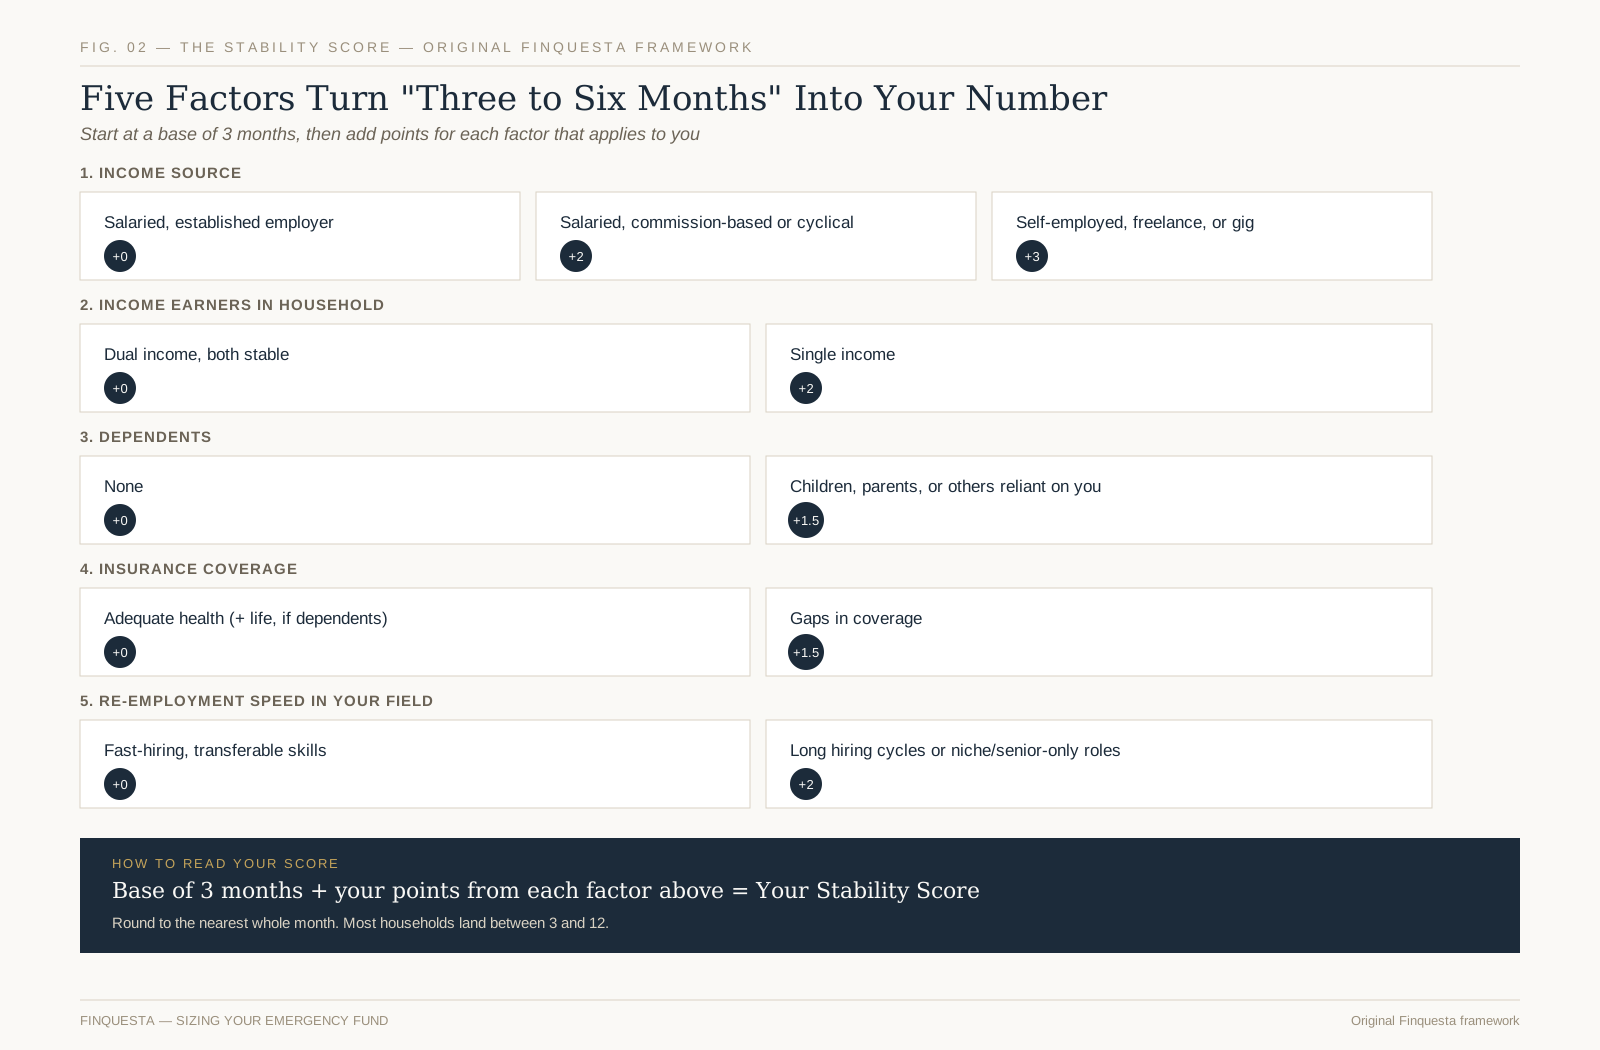
Instead of guessing whether you’re a “three month person” or a “six month person,” the Stability Score turns the decision into simple arithmetic. Start at a base of three months, then add for each factor below that applies to you:

  • Income source: Salaried at an established employer, +0. Salaried but the role is fully commission-based or highly cyclical, +2. Self-employed, freelance, or gig-based, +3.
  • Number of income earners in the household: Dual income, both stable, +0. Single income, +2.
  • Dependents: None, +0. Children, aging parents, or anyone else financially reliant on you, +1.5.
  • Insurance coverage: Adequate health insurance and, if you have dependents, term life cover, +0. Gaps in either, +1.5.
  • Re-employment speed in your field: Roles that are typically filled within weeks (high-demand, transferable skills), +0. Roles with long hiring cycles, niche specializations, or senior-only openings, +2.

Add the applicable points to the base of three, and round to the nearest whole month. A salaried employee in a dual-income household, insured, in a fast-hiring field, lands at exactly three months — the low end of the standard range, and correctly so. A single-income freelancer supporting a child, with an insurance gap, lands closer to nine or ten. Both are “following the three-to-six-months rule” in spirit; only one of them is actually protected.
emergency fund

FIG. 02 — The Stability Score

The score deliberately doesn’t go below three months for anyone, even someone who scores zero on every factor, because unexpected expenses (as opposed to income loss) can hit even the most stable household, and three months is a sensible floor for that alone. It also doesn’t have a hard ceiling — if your factors keep adding up, that’s useful information, not a flaw in the framework.

The Expense Floor: What Your Number Is Actually Multiplying

Original Finquesta framework

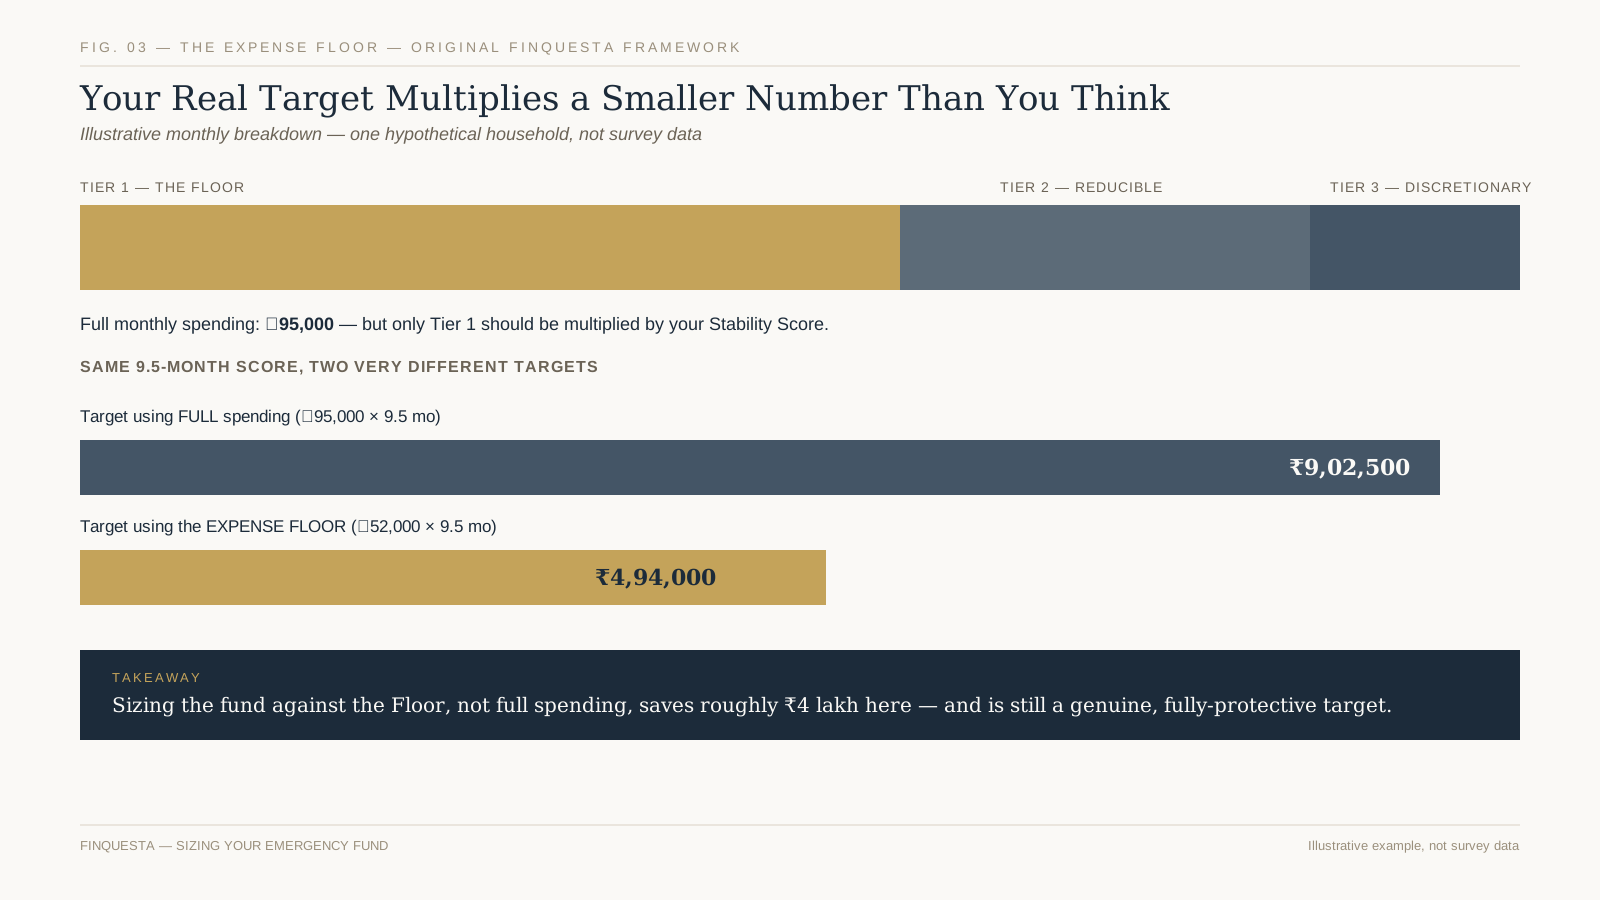
Once you know your target number of months, the next question is: months of what, exactly? Most people multiply their number by their full current monthly spending, which inflates the target and makes it feel out of reach. The Expense Floor method fixes this by splitting spending into three tiers before you multiply anything.

Tier 1 — The Floor. What you cannot avoid paying even in a genuine crisis: rent or EMI, utility connections, insurance premiums, minimum debt payments, and a bare-bones grocery budget. This is the number that should actually get multiplied by your Stability Score.

Tier 2 — Reducible essentials. Costs that continue but could be cut hard for a few months without real harm: your full (rather than bare-bones) grocery spend, transport, phone and internet plans, and similar recurring costs. Worth tracking, but not the number to size your fund against.

Tier 3 — Discretionary. Dining out, entertainment, subscriptions you’d cancel without much thought, shopping, and travel. This tier effectively disappears the day an emergency starts, which is exactly why it shouldn’t inflate your target.
emergency fund

FIG. 03 — The Expense Floor

The gap between Tier 1 and your full current spending is usually larger than people expect — often a third or more of the total — which means a fund sized against the Floor, rather than against everything you currently spend, is both more accurate and considerably faster to reach. This doesn’t mean Tiers 2 and 3 don’t matter; it means they belong in your monthly budget, not in the emergency-fund target.

A Quick, Worked Example: Sizing One Emergency Fund End to End

Back to Meera. Her current monthly spending, all in, runs about ₹95,000. Applying the Expense Floor: her Tier 1 (rent, a health insurance premium, utilities, minimum EMI on a laptop loan, and bare groceries) comes to roughly ₹52,000. Tiers 2 and 3 — the rest of her groceries, transport, subscriptions, and the dining and shopping she’d happily cut for a few months — make up the remaining ₹43,000.

Her Stability Score: self-employed and fully variable income (+3), single income with no other earner in the household (+2), no dependents (+0), an insurance gap since she’s never bought term cover (+1.5), and a field — freelance design — that hires reasonably fast for good portfolios (+0). Base of 3, plus 6.5, rounds to roughly 9–10 months.

Nine and a half months against a Floor of ₹52,000 is about ₹4.9 lakh — a real number, and still a large one, but noticeably more achievable than nine and a half months against her full ₹95,000 in spending, which would put the target above ₹9 lakh. The framework doesn’t make the number small. It makes the number honest, and honest numbers are the ones people actually save toward.

Figures in this example are illustrative and constructed for demonstration only — they are not survey data or typical-case averages.

How Much Emergency Fund You Need, By Situation

For a faster read, here’s how the Stability Score tends to land across common situations. Treat these as starting estimates, not a replacement for running your own numbers above.

SituationTypical rangeWhy
Salaried, dual income, no dependents, insured3–4 monthsLowest-risk combination; two incomes rarely fail at once
Salaried, single income, no dependents, insured4–5 monthsOne point of failure, but no dependents to protect
Salaried, single income, with dependents6–8 monthsOne point of failure, and the cost of that failure is higher
Freelance, commission-based, or gig income6–10 monthsIncome variability is the dominant factor regardless of household structure
Business owner (business is the income source)9–12 monthsThe “job” and the “employer” are the same entity — no separation between the two risks
Near-retirement or retired, drawing down savings12–24 monthsSequence-of-returns risk means a market downturn plus a cash need can compound badly

Where Priority Should Sit: Emergency Fund vs. Debt vs. Investing

A fair question once the target number exists: should it come before paying off debt, or before investing? Bank rate’s 2026 data shows real people split roughly three ways on this already — 29% prioritize savings, 21% prioritize debt paydown, and 31% try to do both at once. A reasonable sequence, in order:

  1. A small starter buffer first — often cited around $500–$1,000 or roughly ₹15,000–₹25,000 — before anything else, so a minor surprise doesn’t immediately become new debt.
  2. High-interest debt next, credit cards especially. The interest saved by clearing a card charging 30%+ APR almost always outweighs what the same money would earn sitting in a liquid fund or savings account.
  3. Back to the emergency fund, building it to your full Stability Score target.
  4. Investing surplus beyond the fund, once the target is fully met.

The one exception: if your income is unstable enough that a gap could force you into new high-interest debt regardless, building the fund further before aggressively attacking existing debt can be the more defensive move — this is a judgment call based on your own volatility, not a universal override of the sequence above.

Where to Actually Keep an Emergency Fund

The fund needs to be liquid, low-risk, and separate enough from everyday spending that it doesn’t quietly get absorbed into it. Beyond that, the right instrument differs by country.

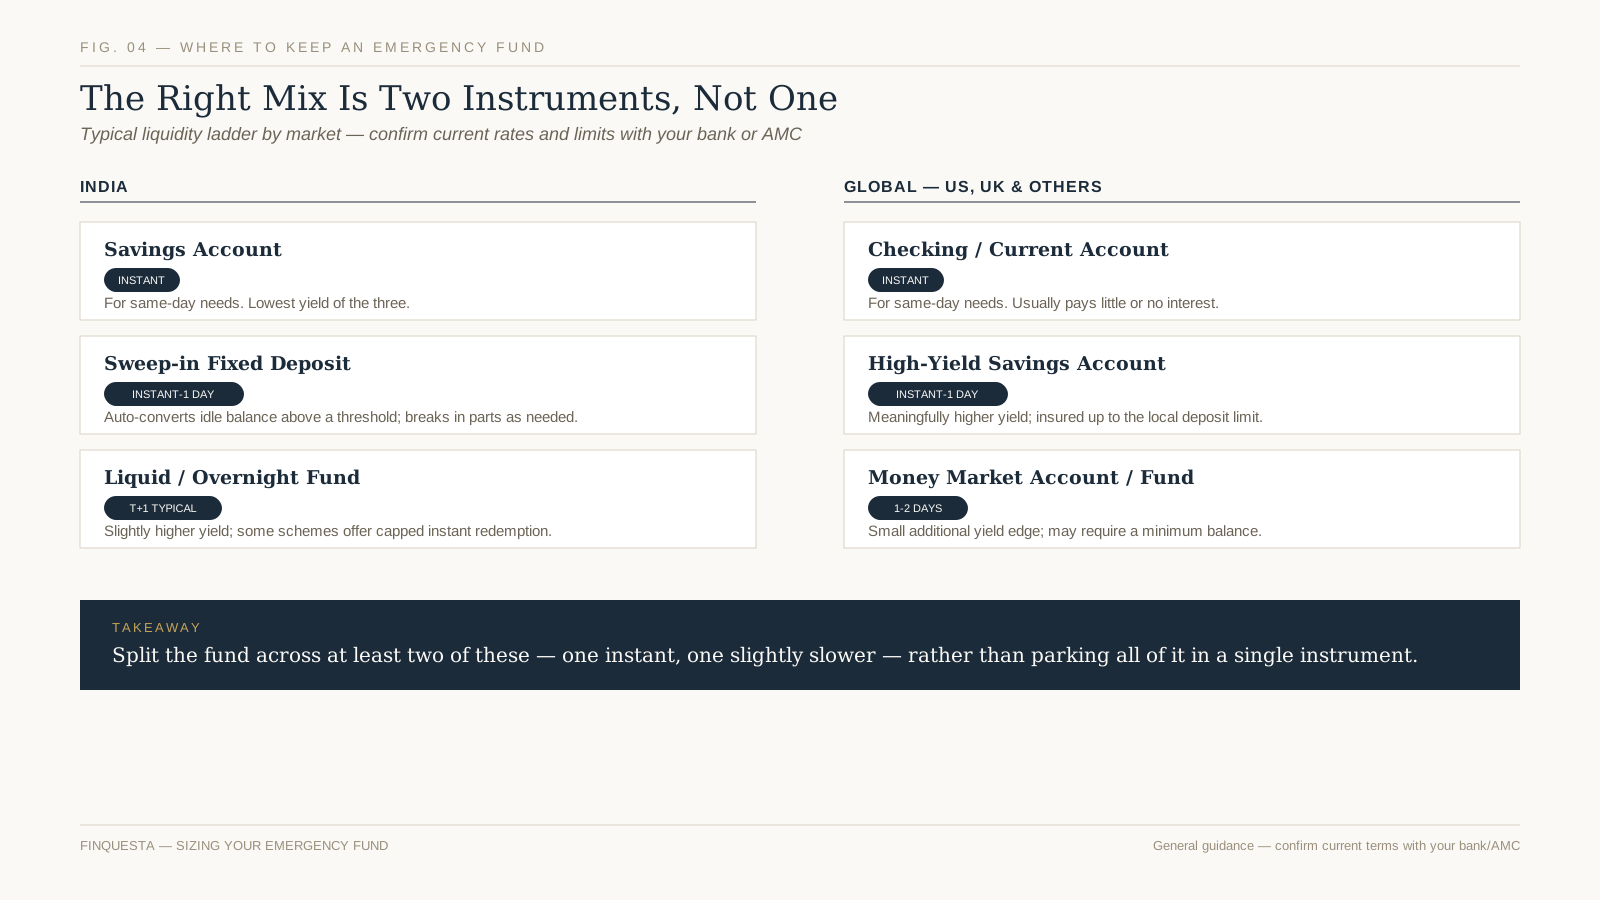
In India, the emergency fund is typically split across two or three of the following: a plain savings account for instant access, a sweep-in fixed deposit (which auto-converts idle balances above a threshold into a short FD and sweeps them back on demand), and a liquid or overnight mutual fund for the portion you’re less likely to need same-day. Liquid funds are a category of mutual fund — the same wrapper used for far more volatile equity schemes — so if you’re new to how funds work generally, it’s worth understanding the basics first. Bank deposits in India are insured by the DICGC up to ₹5 lakh per depositor per bank, covering both principal and interest combined.

In the US, UK, and other markets, the equivalent split is usually a checking account for instant access, paired with a high-yield savings account or money market account for the bulk of the emergency fund. In the US, standard FDIC deposit insurance covers up to $250,000 per depositor, per insured bank, per ownership category. A CD or fixed-term deposit can hold a small slice of a very large fund, but avoid locking up more than you’re confident you won’t need before maturity — early withdrawal penalties defeat the purpose.
emergency fund

FIG. 04 — Where to Keep an Emergency Fund

Whichever country you’re in, a workable split looks roughly like: one part instantly accessible for genuine same-day needs, and the remainder in something that pays a little more while still settling within a day or two. Don’t let the pursuit of yield push any of it into an instrument that can drop in value or lock you out when you actually need it.

One instrument worth being wary of in either market: cash sitting in a zero-interest current or checking account “for safety.” It’s liquid, but it quietly loses purchasing power every year to inflation — the one risk an emergency fund can’t avoid just by sitting still. The fund doesn’t need to beat inflation, but it should at least keep pace, which a plain non-interest account never will.

Can Part of It Work a Little Harder?

Once a fund grows past six or so months of the Floor, a fair question comes up: does all of it really need to sit in the lowest-yielding option available? For the bottom layer — the portion you might need same-day — no shortcuts. But the top layer of a larger fund, the part you’re unlikely to touch inside a week even in a real emergency, can reasonably sit in short-duration instruments that still prioritize capital preservation: a liquid fund rather than a plain savings account, or in some markets a short-term government treasury bill accessed through a demat and trading account.

The distinction to hold onto: this is about slightly better cash management, not investing. If an instrument can meaningfully drop in value over the holding period you’d need it for, it doesn’t belong in the emergency fund, no matter how good the historical yield looks. Any extra yield is also taxable — as per your income slab in India, or largely at ordinary income rates in the US — so factor that in before assuming a marginally higher-yielding option is meaningfully better; the after-tax gap is often smaller than the headline rate difference suggests.

Money that’s genuinely available for investing — because your full fund target is met and this is surplus — is a separate decision with a different time horizon and risk tolerance, worth planning deliberately rather than folding into the emergency allocation by default.

Building It Without Wrecking Your Monthly Budget

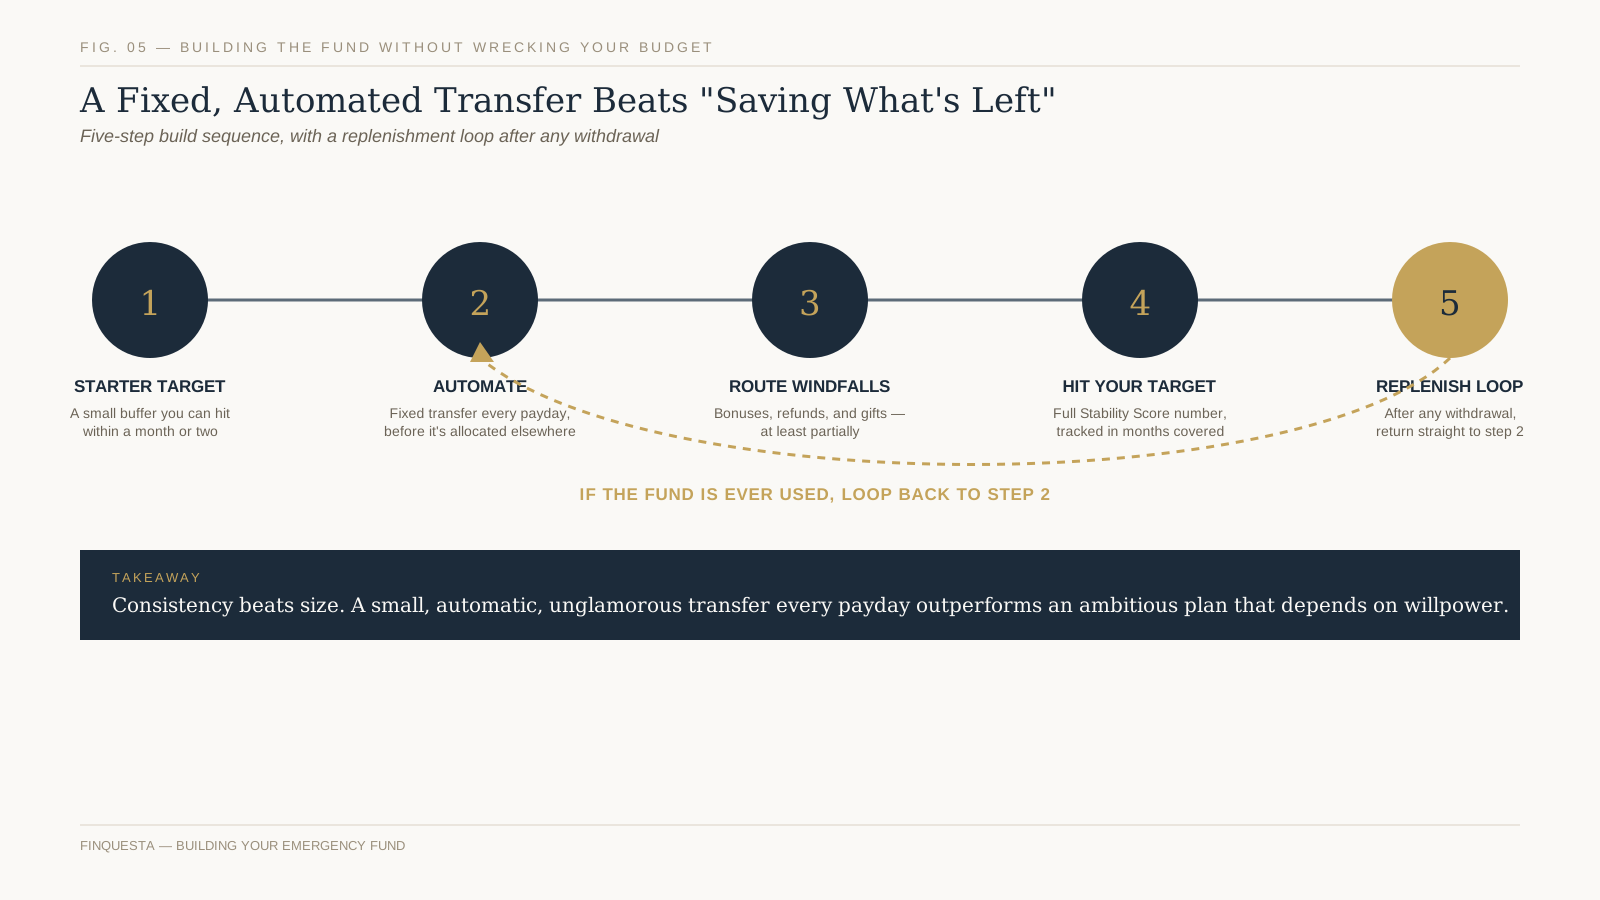
The gap between “I should have an emergency fund” and “I have one” is usually a budgeting problem, not a willpower problem. A workable build sequence:

  1. Set a starter target, not the full number — a small buffer you can hit within a month or two, so the habit starts before the size of the full goal has time to feel discouraging.
  2. Automate a fixed transfer on payday, before the money has a chance to be allocated elsewhere. The amount matters less than the consistency.
  3. Route windfalls in, at least partially — bonuses, tax refunds, gifts, and one-off payments are the fastest way to make real progress without touching monthly cash flow.
  4. Build toward the full Stability Score target, tracking progress in months-covered rather than a raw number, since months-covered is the metric that actually reflects your protection.
  5. Loop back to step 2 after any withdrawal. A fund that isn’t replenished quickly is a fund that will eventually be empty exactly when it’s needed.
emergency fund

FIG. 05 — Building the Fund

None of this requires a dramatic lifestyle change. A fund built from a fixed, automated, unglamorous transfer every payday reliably outperforms one that depends on remembering to “save what’s left” — because for most households, on most months, there isn’t anything left by design.

How Often to Recalculate Your Number

A Stability Score and an Expense Floor calculated once and never revisited quietly go stale, usually in one of two directions. Life changes shift the Stability Score itself — a new dependent, a job switch into a less stable field, a lapsed insurance policy, or a household going from two incomes to one are each reason enough to rerun the calculation immediately, rather than waiting for a scheduled review.

The Expense Floor drifts for a quieter reason: inflation. Bankrate’s 2026 report found that 54% of Americans say rising prices are causing them to save less for emergencies — and the same rising prices mean the Floor calculated two years ago is very likely understating what three to six months of rent, utilities, and groceries actually costs today. A fund that was correctly sized in 2024 can be meaningfully undersized by 2026 without a single rupee or dollar having been withdrawn from it.

A simple annual habit avoids both problems: recalculate the Expense Floor once a year on a fixed, easy-to-remember date — a birthday, the start of a financial year — and recalculate the Stability Score immediately after any life change, rather than folding it into the annual check. Treat the emergency fund as a number that needs occasional maintenance, not a target that’s finished forever once it’s hit.

Signs You’re Keeping Too Little — or Too Much

Too little shows up as anxiety with a specific trigger: a single unexpected bill derails the month, or a minor repair gets put on a credit card by default rather than by choice. If that’s happened more than once in the past year, the Stability Score above is worth running properly rather than estimating.

Too much is quieter, and easier to miss, because it doesn’t cause visible stress — it just sits there. A fund that’s grown to eighteen months of the Floor for a dual-income, insured, salaried household with no dependents isn’t dangerous, but it is an opportunity cost: money that could be working toward retirement, a down payment, or any other goal, parked instead in an account built for safety rather than growth. If your Stability Score points to four months and your balance covers fourteen, the honest move is to redirect new contributions elsewhere, not to keep stacking cash for its own sake.

The One Rule for Using It Without Guilt

The emergency fund exists to be used. Bankrate’s data shows 37% of US adults tapped their emergency savings in the past year — and for the large majority, that’s the system working exactly as intended, not a failure. The one rule that matters: if it meets the definition from earlier in this piece — unplanned, necessary, and costlier to delay than to pay now — using the fund is the entire point, and there’s no reason to feel like you’ve failed some test by doing what the money was set aside for.

The guilt that sometimes comes with dipping into savings usually points to a different problem: the emergency fund wasn’t clearly separated from other savings goals in the first place, so spending it feels like it’s competing with the vacation fund or the wedding gift fund, even when it isn’t. A dedicated account, even a free one at the same bank, solves this more effectively than willpower does.

After You Use It: Rebuilding, Fast

Replenishment deserves the same automation as the original build, not a vague intention to “get back to it eventually.” The fastest path back: temporarily redirect any other savings automation — investing contributions, a separate goal fund — toward the emergency fund until it’s back to target, then resume the original allocation. This trades a few months of slower progress on other goals for restoring the safety net that protects all of those goals simultaneously.

If the withdrawal was large relative to income, rebuilding in stages is reasonable: get back to the starter buffer first, then work back up to the full Stability Score target, rather than treating the whole gap as one target that has to be hit all at once.

Common Mistakes That Quietly Undermine an Emergency Fund

A few patterns show up repeatedly, and each one is fixable once it’s named:

  • Sizing it against full spending instead of the Floor. This is the single biggest reason people either never start or give up early — the target feels far larger than it needs to be.
  • Keeping it somewhere too easy to spend. A fund sitting inside the same account used for daily spending gets absorbed into daily spending, a little at a time, without ever feeling like a withdrawal.
  • Keeping it somewhere too hard to access. The opposite mistake — locking the whole fund into a long FD or a fund with a multi-day redemption cycle — turns a same-day emergency into a multi-day wait.
  • Never replenishing after a withdrawal. A fund used once and never rebuilt is a fund that only protects you the first time.
  • Treating a large fund as untouchable for anything else. Once the Stability Score target is genuinely met, additional cash sitting idle indefinitely is a missed opportunity, not extra safety.
  • Skipping insurance and calling the fund “coverage” instead. An emergency fund is not a substitute for health insurance or, where dependents are involved, life insurance — it’s a buffer for the gaps and deductibles insurance doesn’t cover, not a replacement for having it.

Frequently Asked Questions

How much emergency fund should I have in India?

Most advisors suggest three to six months of essential expenses — rent or EMI, utilities, groceries, insurance premiums, and minimum debt payments — kept in a liquid fund, sweep-in FD, or high-interest savings account. Salaried employees with stable jobs and adequate health insurance can often stay near the lower end of that range. Freelancers, commission-based earners, and single-income households with dependents are usually better served by six to twelve months. The Stability Score framework above turns this from a guess into a specific number based on your actual situation.

What is the 3 to 6 month rule for emergency funds?

It’s shorthand for keeping three to six months of essential living expenses in an accessible account, so a job loss or income gap doesn’t force you into debt. The rule doesn’t mean three to six months of your salary — it means the bare cost of staying afloat: housing, utilities, food, insurance, and minimum debt payments. It’s a reasonable range for a single salaried earner with no dependents, but it understates what self-employed people, single-income households, and those without insurance typically need.

Is 3 months of expenses enough for an emergency fund?

For some people, yes — typically a salaried employee in a stable field, part of a dual-income household, with health insurance and no dependents. For others, three months barely covers a typical job search. The US Federal Reserve’s 2025 household survey found only 55% of adults had even that much set aside, and that’s treated as a reasonable minimum, not a comfortable cushion. If your income is variable, or you’re the sole earner supporting dependents, treat three months as a floor to build past rather than a finish line.

Can I lose money in an emergency fund?

Not if it’s held correctly. An emergency fund belongs in a savings account, sweep-in FD, or liquid or overnight mutual fund — instruments built to preserve capital, not grow it aggressively. Liquid funds can show very small day-to-day NAV movements, but a fund holding high-quality, short-maturity debt is designed to avoid meaningful losses. The real risk isn’t market loss — it’s keeping the fund somewhere you can’t access quickly, or spending it on non-emergencies so it isn’t there when you need it.

Should I pay off debt or build an emergency fund first?

Most planners suggest a small starter buffer first — often ₹15,000–₹25,000 or $500–$1,000 — before aggressively paying down debt. After that, high-interest debt, credit cards especially, usually deserves priority, since the interest cost typically exceeds what a liquid fund or savings account earns. Once high-interest debt is cleared, shift focus back to building the emergency fund to its full target. The exception is when income is unstable enough that a gap could force new high-interest debt regardless — in that case, building the fund further first can be the more defensive move.

How many months of expenses should a self-employed person save?

Six to twelve months is the typical range, and the exact number depends on how variable the income actually is, not just the fact of being self-employed. Someone with several long-term retainer clients and predictable monthly billing can lean toward six months. Someone dependent on a handful of project-based clients, or working in a field with long sales cycles, should lean toward twelve. The Expense Floor method above helps make even the higher end of that range feel more achievable, since it’s based on bare survival costs rather than full current spending.

What is the difference between an emergency fund and a savings account?

A savings account is a type of bank account; an emergency fund is a purpose — money earmarked specifically for genuine emergencies, which often happens to live inside a savings account, sweep-in FD, or liquid fund. The distinction matters because a general-purpose savings account often holds money for several goals at once — a vacation, a gadget, a gift — which makes it easy to quietly spend down the emergency portion without noticing. Keeping the emergency fund in its own separate account, even at the same bank, makes it far easier to leave alone.

Can I keep my emergency fund in mutual funds?

Yes, but only specific types — liquid funds and overnight funds, which invest in very short-maturity, high-quality debt and are built for capital preservation with same-day-to-T+1 access. Equity funds, hybrid funds, and long-duration debt funds are not appropriate, since their value can drop right when the money is needed most. If a liquid fund is used, treat its redemption timeline — typically one business day, with some schemes offering a small instant-redemption facility within daily caps — as part of the planning, since it isn’t instant the way a savings account is.

Disclaimer This article is for informational and educational purposes only and does not constitute financial, investment, tax, or legal advice. Figures, rates, and regulations mentioned are subject to change; please verify current details with official sources (RBI, SEBI, the Income Tax Department, IRS, or a licensed financial advisor) before making financial decisions. Finquesta may earn a commission from affiliate links in this article at no extra cost to you.
PPF vs ELSS vs NPS: The Complete 2026 Comparison

ppf

Every March, millions of salaried Indians rush to top up PPF, buy an ELSS fund, or push a little extra into NPS before the financial year closes. For a growing share of them — anyone who has already moved to the default new tax regime — that entire ritual now saves exactly nothing, because Section 80C simply doesn’t apply to their return anymore.

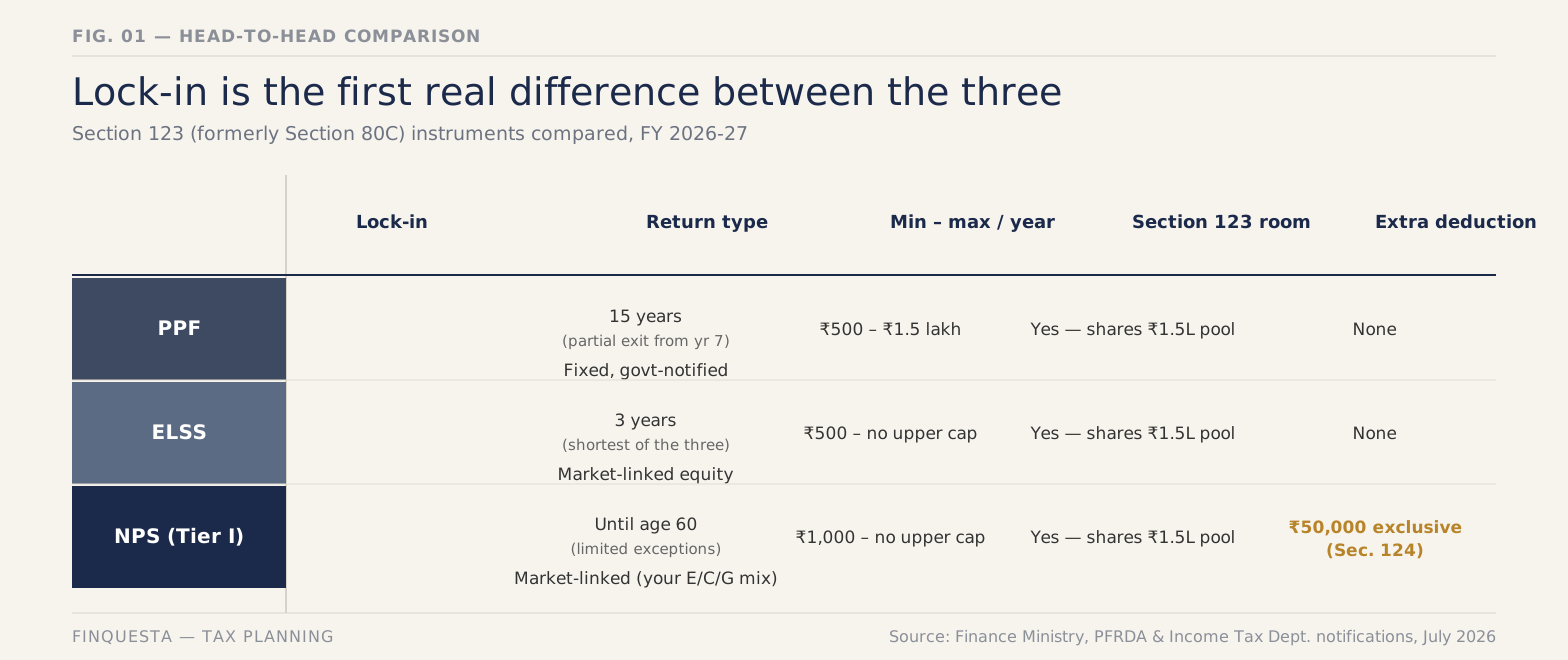
PPF (Public Provident Fund), ELSS (Equity Linked Savings Scheme) and NPS (National Pension System) are India’s best-known tax-saving investments, each linked to what was Section 80C — now Section 123 under the Income-tax Act, 2025. PPF pays a fixed, quarterly-declared rate over 15 years. ELSS is an equity mutual fund with a mandatory 3-year lock-in, the shortest Section 123 option. NPS is a market-linked retirement account, regulated by the PFRDA and locked in until 60, offering an extra ₹50,000 deduction none of the others get.

Why “PPF vs ELSS vs NPS” Only Matters If You’re Still on the Old Tax Regime

Before comparing lock-ins or returns, ask a more basic question: does any of this apply to you at all? The new tax regime has been the default since FY 2023-24. Under the Union Budget 2025 reforms — carried forward unchanged into Budget 2026 — a resident individual owes zero tax on taxable income up to ₹12 lakh.

For a salaried filer, the ₹75,000 standard deduction effectively pushes the tax-free line to roughly ₹12.75 lakh of salary. HRA, Section 123 (old 80C), 80D-type deductions, and the NPS employee-contribution deductions are all disallowed under the new regime, which is exactly what makes that threshold matter here.

If your salary sits under roughly ₹12.75 lakh, the government has already zeroed out your tax bill without you lifting a finger. Investing in PPF, ELSS, or NPS for a “tax benefit” that doesn’t exist for you is solving a problem you don’t have — the money would do more for you sitting in whichever of the three actually fits your goals, tax deduction or not.

Above that income level, or if your deductions — home loan interest, HRA, Section 123, medical insurance — are large enough to beat the new regime’s lower slabs on their own, the old regime becomes worth actively choosing (via Form 10-IEA for those without business income), and this entire comparison starts to matter again. That’s who the rest of this guide is written for.

What Is PPF (Public Provident Fund)?

Meera opened her PPF account the year she got her first job offer letter, mostly because her father told her to. Fifteen years is a strange number to commit to at 23, but that’s exactly the point — PPF rewards the version of you that doesn’t touch it.

PPF is a savings scheme run through post offices and most major banks, backed by a sovereign guarantee, currently paying 7.1% per annum for the July–September 2026 quarter. The Finance Ministry has held this rate unchanged since April 2020, most recently confirmed in its June 30, 2026 notification on small savings schemes; it’s reviewed every quarter and can change, though it’s been remarkably stable for over six years.

You can invest between ₹500 and ₹1.5 lakh in a financial year, and interest compounds annually on the lowest monthly balance. The account matures 15 years after opening, not from your first deposit, and at maturity you can either withdraw the full amount, or extend it in blocks of five years — with or without making further contributions during the extension.

A loan against the balance is available from the third year through the sixth year. Partial withdrawal opens up from the seventh financial year onward, capped at the lower of 50% of the balance at the end of the fourth preceding year or the immediately preceding year. Both the interest and the maturity amount are entirely tax-free, regardless of which tax regime you file under.

What Is ELSS (Equity Linked Savings Scheme)?

Rohan did the opposite of Meera. He picked ELSS specifically because he didn’t trust himself to stay invested for 15 years, and three felt survivable.

ELSS is an open-ended equity mutual fund — meaning it invests at least 80% of its portfolio in stocks — that carries a mandatory 3-year lock-in, the shortest of any Section 123 (formerly 80C) instrument. You can invest via SIP or lump sum, and there’s no upper cap on how much you can put into ELSS itself, though only ₹1.5 lakh of it counts toward your deduction in a given year.

Like any equity mutual fund, ELSS is available as a direct plan (bought straight from the fund house, lower expense ratio) or a regular plan (bought through a distributor, with a trail commission built into the cost). The lock-in, tax treatment, and underlying stocks are identical either way — only the expense ratio and whether you get advice alongside the investment differ, which is worth knowing before you assume the two are interchangeable.

Because it’s equity, returns aren’t fixed or promised — they track whatever the fund’s underlying stocks do, for better and for worse. Once the 3-year lock-in ends, gains are taxed as long-term capital gains at 12.5% on anything above ₹1.25 lakh in a financial year, a rate applied the same way regardless of which tax regime you file under, since capital gains taxation sits outside the Section 123/regime framework entirely.

What Is NPS (National Pension System)?

NPS is the odd one out in this comparison, because it isn’t really a tax-saving product that happens to fund retirement — it’s a retirement product that happens to save tax along the way. Regulated by the Pension Fund Regulatory and Development Authority (PFRDA), it invests your contributions across equity (E), corporate bonds (C), and government securities (G), in a mix you choose yourself (active choice) or that shifts automatically toward safety as you age (auto choice).

Since inception, government-sector NPS has delivered an average CAGR of about 9.5%, while non-government-sector asset classes have returned roughly 14% for equity, 9.1% for corporate debt, and 8.8% for government securities, according to Finance Minister Nirmala Sitharaman’s remarks at the September 2024 launch of NPS Vatsalya. Treat these as a long-run reference point, not a promise — markets and fund manager performance both move around a lot year to year.

Your own contribution to a Tier I account is locked in until age 60, with limited exceptions. NPS is also the only one of the three that carries an extra deduction — up to ₹50,000 under what was Section 80CCD(1B), independent of the ₹1.5 lakh Section 123 ceiling — which is the single biggest reason people include it in this comparison at all.

Under auto choice, NPS uses lifecycle funds that start you at a higher equity allocation in your twenties and thirties, then taper equity down and shift toward government securities as you approach 60 — a glide path similar in spirit to a target-date fund, just built specifically around the retirement age NPS assumes for you. Active choice hands you the steering wheel directly, letting you set and rebalance your own E/C/G split, within PFRDA-set limits on how much can sit in equity at any age.

Tier I vs Tier II — The NPS Distinction Most Comparisons Skip

Most comparisons like this one talk about “NPS” as if it’s a single account, and quietly gloss over the fact that it’s actually two. Tier I is the pension account — the one that carries every tax benefit discussed in this guide, and the one locked in until 60. Tier II is a voluntary add-on savings account with no lock-in at all; you can withdraw from it any working day, like a mutual fund folio.

The catch is that Tier II carries no tax deduction for most subscribers — you don’t get a Section 123 or Section 124 benefit for money parked there, with a narrow exception for certain government employees under a separate scheme. For everyone else, Tier II functions as a flexible, market-linked savings account that happens to sit inside the NPS ecosystem, not a tax-saving vehicle in its own right.

This matters for the comparison because every NPS figure elsewhere in this guide — the lock-in until 60, the ₹50,000 deduction, the 80%/60% withdrawal question — refers specifically to Tier I. If you ever see NPS Tier II pitched to you as a tax-saving option the way PPF or ELSS is, that’s worth double-checking against the current rules before you assume it works the same way.

PPF vs ELSS vs NPS: Lock-In and Liquidity Compared

Lock-in is where these three instruments stop looking like three flavors of the same thing and start looking like genuinely different financial products. ELSS lets go of you after three years. PPF holds on for fifteen, with a partial-withdrawal escape hatch from year seven. NPS Tier I doesn’t really let go until you turn 60, full stop.

That gap is the first filter worth applying to your own decision, well before you get to returns or risk: if there’s a real chance you’ll need this money in the next five years, NPS is disqualified before the conversation even starts, and PPF only clears the bar if year seven onward lines up with your plans. For a deeper look at how fund structure affects access to your money, explains how open-ended mutual funds like ELSS differ from other pooled investments more broadly.

How the New Income Tax Act, 2025 Renames (But Doesn’t Remove) These Deductions

Here’s something most PPF vs ELSS vs NPS comparisons published before mid-2026 won’t tell you, simply because it hadn’t happened yet when they were written: the Income-tax Act, 1961 has been replaced. The Income-tax Act, 2025 took effect on April 1, 2026, and governs Tax Year 2026-27 onward — the year most readers of this guide are currently investing for.

Under the new Act, familiar section numbers have been reorganised into a single sequential system. Section 80C — the ₹1.5 lakh umbrella that PPF and ELSS both sit under — is now Section 123, read with Schedule XV. The NPS-specific deductions that used to live under Section 80CCD are now grouped under Section 124.

None of the deduction amounts changed, and none of the eligible instruments changed — this is a renumbering exercise, not a policy shift. One practical wrinkle is worth flagging anyway: if you’re filing your return for FY 2025-26 in July 2026, you’re still using the old 1961 Act’s section numbers on that form. The new numbers only apply starting with returns for FY 2026-27, filed in 2027 — the kind of gap that trips people up precisely because both systems are technically “current” at once, for different tax years.

How Much Tax Each Instrument Actually Saves You

The honest way to think about the tax benefit here isn’t “PPF vs ELSS vs NPS” — it’s two separate buckets that happen to share a wall.

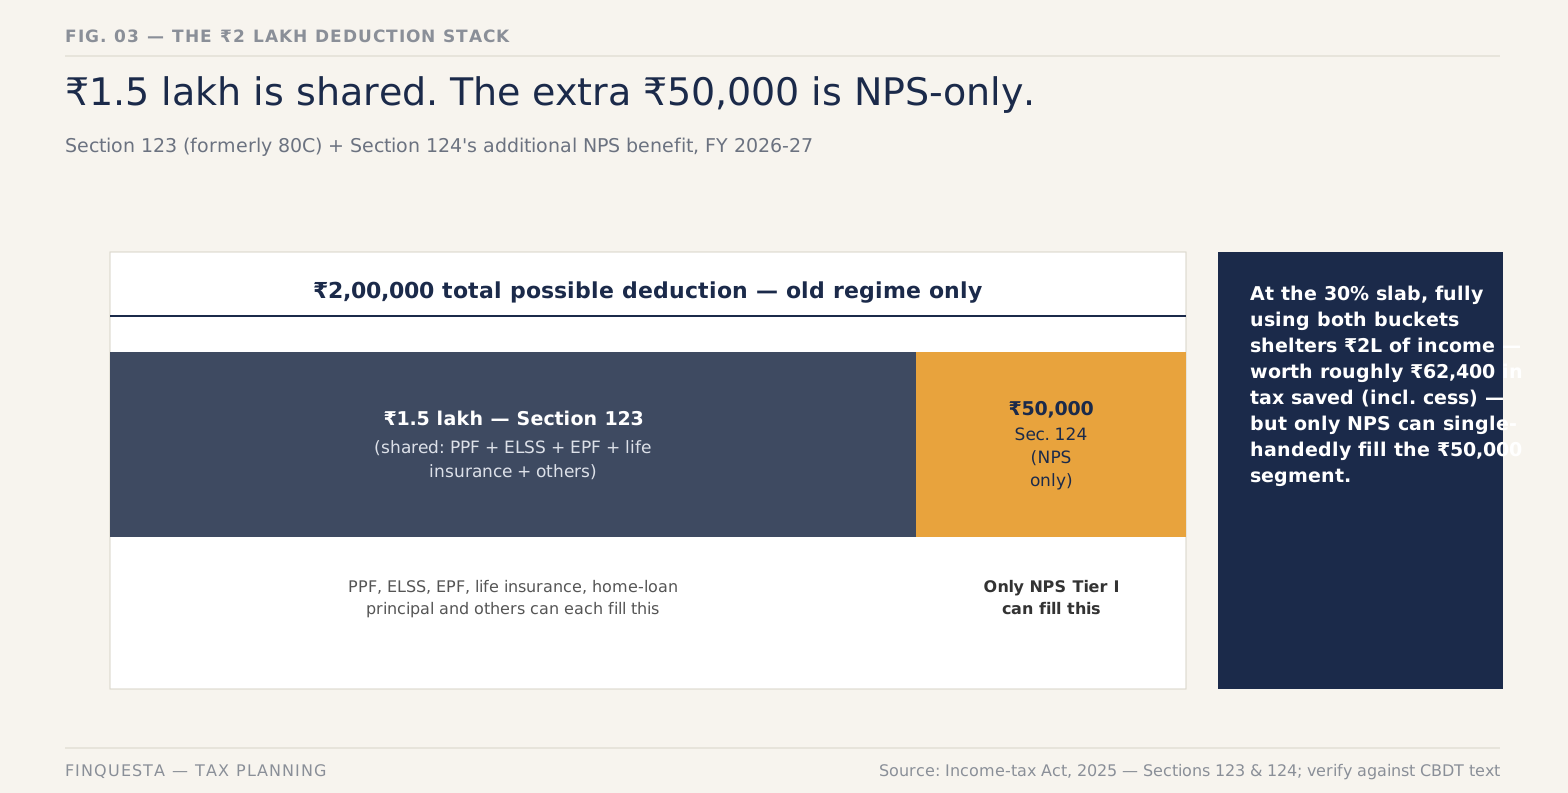
Bucket one is Section 123 (old 80C), capped at ₹1.5 lakh combined across PPF, ELSS, life insurance premiums, EPF, and a handful of other instruments. Put ₹1.5 lakh into PPF alone, and there’s nothing left for ELSS to add here, even if you invest more in it. Bucket two is the NPS-exclusive ₹50,000 under Section 124’s additional-deduction clause, which doesn’t touch bucket one at all — max out both, and you’ve sheltered ₹2 lakh of income, but only NPS can single-handedly fill bucket two.

For someone in the 30% slab (plus 4% cess), that ₹50,000 NPS-only deduction is worth roughly ₹15,600 in tax saved every year it’s used, at zero extra cost beyond accepting the lock-in. That’s precisely why planners tend to describe it as one of the highest-leverage single moves available under the old regime, even for people who’ve already maxed out their ₹1.5 lakh elsewhere.

There’s a fourth instrument already quietly eating into that same ₹1.5 lakh bucket for most salaried readers, and most comparisons like this one never mention it: EPF (Employee Provident Fund). Your mandatory 12% employee contribution to EPF also falls under Section 123, alongside PPF and ELSS, not in some separate allowance.

For a salaried employee already contributing a meaningful EPF amount every month, the real question usually isn’t “how do I split ₹1.5 lakh across PPF, ELSS and NPS” — it’s “how much of that ₹1.5 lakh does EPF leave for the other two.” Someone with ₹1.2 lakh of annual EPF contribution has only ₹30,000 of Section 123 room left, regardless of how much they’d like to put into PPF or ELSS.

This is worth checking on your payslip or Form 16 before you plan a PPF or ELSS contribution around the full ₹1.5 lakh figure — a number this guide, and most others, uses as a clean round ceiling that assumes you’re starting from zero.

Returns — One Fixed, One Market-Linked, One In Between

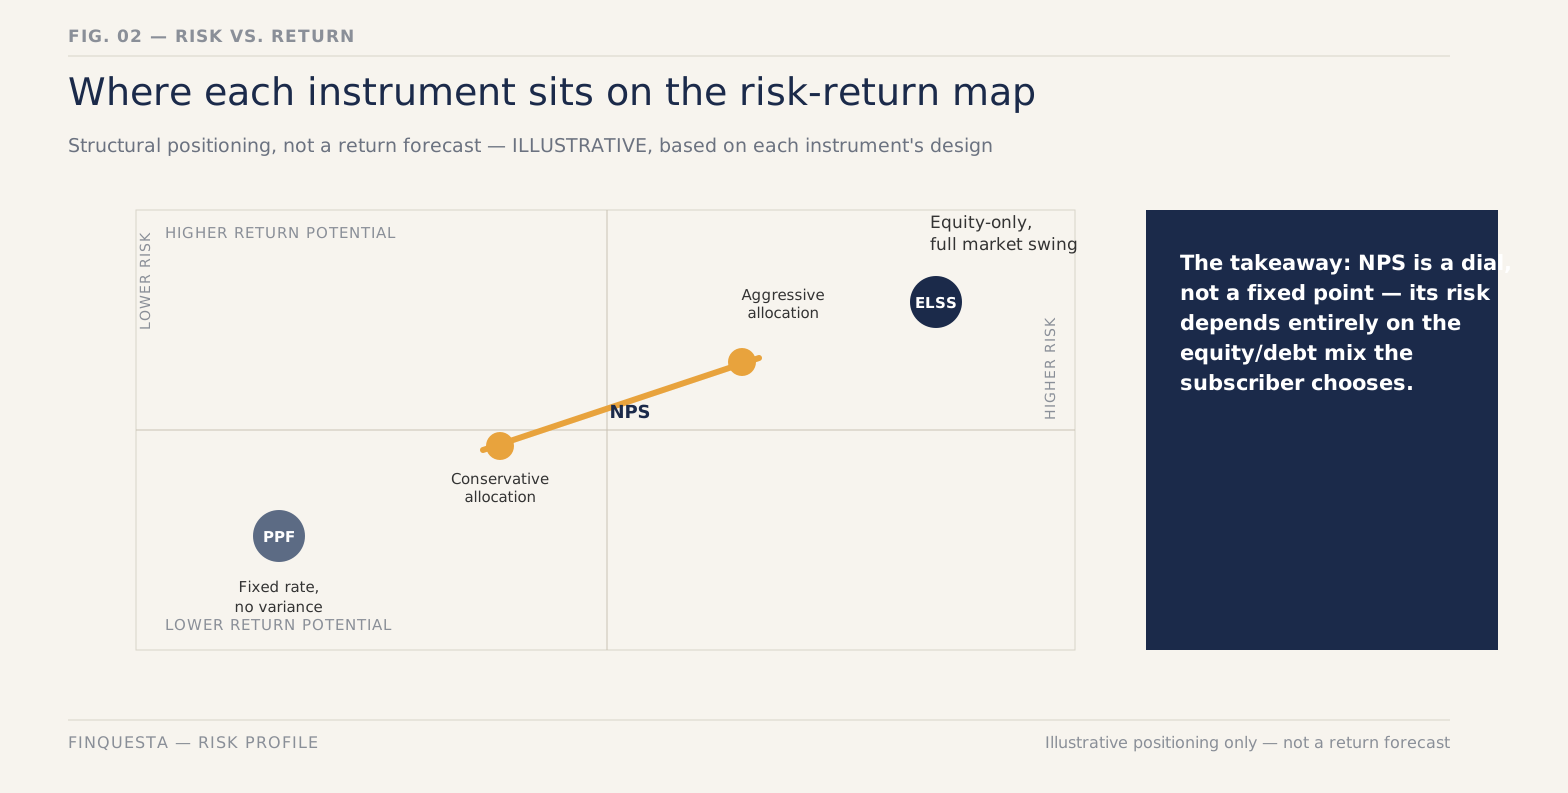
PPF’s return isn’t really a forecast — it’s whatever the government notifies each quarter, currently 7.1%, and it moves slowly by design. ELSS has no floor and no ceiling; a strong three-year window can outrun both PPF and NPS by a wide margin, and a weak one can leave you at breakeven or worse. NPS sits between the two by construction — you choose how much of your money sits in equity, corporate debt, and government securities, so its return profile is really a dial you control, not a fixed number.

Resist the urge to rank these three by a single trailing-return number pulled from any one year. A three-year window that happens to end in a market peak makes ELSS look unbeatable, and one that ends in a correction makes it look reckless — neither is the full story. The honest comparison isn’t “which had the best return last year,” it’s “which return profile matches how much volatility you can actually sit through without pulling out at the wrong time.”

Risk — What You’re Actually Signing Up For

PPF’s risk isn’t market risk — it’s the risk that 7.1% quietly loses to inflation over 15 years, since the rate is fixed by notification, not by markets. Nothing about a PPF passbook ever looks alarming, which is exactly why this risk is the easiest of the three to miss.

ELSS carries real, visible volatility: it can be down 15% the year after you invest, which is exactly why the 3-year lock-in exists. It’s a guardrail against panic-selling into a dip, not just a tax rule bolted on for no reason.

NPS’s risk depends entirely on the equity/debt mix you pick. An aggressive allocation behaves like ELSS with extra bureaucracy, and a conservative one behaves closer to PPF, but with market exposure standing in for a fixed rate — meaning “how risky is NPS” doesn’t have one answer until you know which allocation a subscriber actually chose.

The Regime Survivors Test — An Original Finquesta Framework

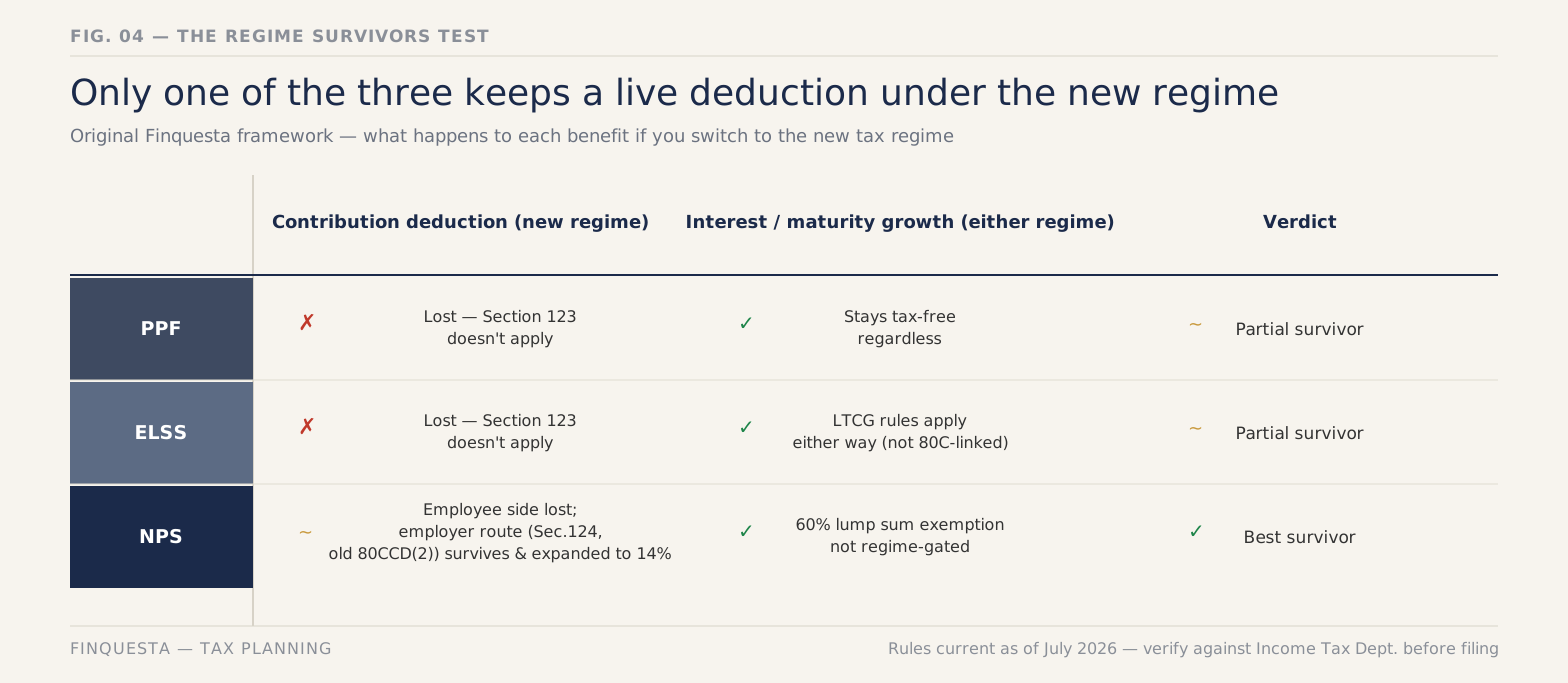
Most comparisons treat PPF, ELSS, and NPS as three peers standing side by side. They stop being peers the moment you ask a sharper question: if you switched to the new tax regime tomorrow, which part of each instrument’s benefit would actually survive?

Run PPF through the test and the contribution deduction dies instantly — Section 123 doesn’t exist for new-regime filers. But the interest and maturity amount stay tax-free regardless, because that exemption lives under a separate provision that was never regime-gated in the first place. Most people conflate “losing the 80C benefit” with “PPF becomes taxable,” and that’s simply wrong — only the deduction on the way in disappears.

Run ELSS through the same test and the deduction dies the same way, but ELSS loses something PPF doesn’t. Without the tax benefit, there’s no longer any reason to accept a 3-year lock-in over an identical-strategy equity fund with no lock-in at all — under the new regime, “ELSS” as a distinct product effectively stops making sense, even though the underlying fund keeps running fine.

NPS is the only one that comes out ahead. Its employee-side deductions — Section 124’s equivalent of 80CCD(1) and the ₹50,000 top-up — die under the new regime exactly like the others’ do.

But the employer contribution route, under what was Section 80CCD(2), not only survives the new regime, it was expanded: the deductible cap rose to 14% of salary for all employers from FY 2025-26, up from 10% for private-sector staff. If your employer offers NPS through a flexible-benefits structure, that’s a live tax lever whether or not you file Form 10-IEA to opt into the old regime.

The Exemption Gap — NPS’s New 80% Withdrawal Rule vs. Its 60% Tax-Free Ceiling

In December 2025, the PFRDA overhauled NPS exit rules. Non-government subscribers can now withdraw up to 80% of their corpus as a lump sum at retirement, up from 60%, with the mandatory annuity portion falling to a minimum of 20%. Government-sector subscribers stay on the older 60%/40% split. Call the mismatch this creates the Exemption Gap — an original Finquesta framework for a problem that doesn’t have an official name yet.

Here’s the catch almost no one has caught up on yet: the tax exemption under what was Section 10(12A) — the provision that makes your NPS lump sum tax-free — was written around the old 60% ceiling and hasn’t been amended to match. The newly-permitted extra 20%, the slice between 60% and 80%, is therefore taxable at your slab rate rather than automatically tax-free, as things currently stand.

Practically, this means the headline “you can now take out 80%!” is true and slightly misleading at the same time. You can, but doing so without a plan could hand back in tax a chunk of what the new rule just gave you. Anyone retiring in the next few years should model both the 60% and 80% withdrawal scenarios before deciding, rather than assuming more lump sum is automatically the better outcome.

ELSS SIP vs Lump Sum — Does the Lock-In Reset Every Month?

Yes, and this catches people off guard. A lump sum investment locks in for three years from that one date. A SIP is different — each monthly instalment is treated as its own separate investment, so your January instalment unlocks in three years, February’s unlocks a month after that, and so on, all the way through the SIP.

This isn’t a flaw; it’s just how a rolling investment works. In practice it means an ongoing ELSS SIP never fully “unlocks” while you keep contributing, since there’s always a slice still inside its own three-year window. That’s worth knowing before you assume you can redeem the entire pot the moment your very first instalment crosses the three-year mark.

PPF vs ELSS vs NPS for the Self-Employed

Salaried employees get one extra lever the self-employed don’t: the employer NPS route under Section 124 (old 80CCD(2)), which survives in both tax regimes. Without an employer, that lever simply isn’t available, which quietly shifts the self-employed comparison of PPF vs ELSS vs NPS toward the old regime mattering more, not less, since it’s the only place any of the three still offers a deduction.

For self-employed investors, NPS’s own-contribution deduction under Section 124 is capped at 20% of gross total income, versus 10% of salary for the salaried — which can work out to a meaningfully larger number for a high-earning freelancer or business owner than the salaried version of the same rule. PPF and ELSS work identically regardless of employment status, since both are personal accounts with no employer link at all.

Income variability is the other practical factor worth weighing here. PPF’s ₹500 minimum and flexible deposit schedule within the year suit a freelancer’s uneven cash flow better than a fixed monthly SIP commitment might, in a slow month. Neither NPS nor ELSS requires a fixed contribution either, but a lapsed PPF deposit in a given year only needs a small penalty to reactivate, which is a gentler failure mode than letting an NPS account go inactive.

Can You Use All Three Together? A Practical Way to Split ₹2 Lakh

Most people don’t need to pick a single winner — they need a way to fill ₹2 lakh across two buckets without overthinking it. Start with the ₹50,000 NPS-only deduction, since nothing else can fill it, then split the remaining ₹1.5 lakh across PPF and ELSS based on how much volatility you can tolerate and how soon you might need the money.

Someone five-plus years from any major goal, with a stable income and a stomach for equity swings, might lean harder into ELSS for the growth and use PPF as the boring, guaranteed anchor for the rest of the ₹1.5 lakh. Someone closer to a goal, or who knows they’d panic-sell in a downturn, is often better served doing more of that ₹1.5 lakh through PPF and treating ELSS as a smaller, deliberate bet on the side.

Neither answer is wrong — the split should track your own tolerance for watching the number go down, not a generic rule of thumb copied from a friend’s portfolio. walks through a broader framework for matching investment types to specific goals, which extends the same logic beyond just these two instruments.

How Often Do These Rules Change? (And Why That Matters for Your Plan)

If this article feels unusually preoccupied with dates and version numbers, that’s deliberate. In the twelve months before this guide was published, PPF’s rate was reconfirmed quarterly, the entire Income Tax Act was replaced and renumbered, NPS’s withdrawal rules were overhauled by the PFRDA, and the new regime’s rebate threshold was reset by the Union Budget. None of that is unusual — it’s the normal pace of change for these three instruments.

The practical takeaway isn’t to distrust any comparison like this one; it’s to treat the numbers as time-stamped and the mechanics as durable. PPF being a fixed-rate government scheme, ELSS having a 3-year lock-in, and NPS being locked till 60 are structural facts unlikely to change soon. The exact rate, the exact deduction limit, and the exact withdrawal split are exactly the kind of details worth re-checking against an official source before you act on them, even if you read this guide the week it was published.

Common Mistakes Investors Make Between PPF, ELSS and NPS

The single most common one: investing in all three under the new tax regime, for a deduction that no longer exists on the contribution side, purely out of habit from years past. Check your regime before your March tax-saving rush, not after.

A second mistake is treating PPF’s 7.1% as risk-free in every sense. It’s default-risk-free, not inflation-risk-free, and 15 years of a rate that barely beats inflation can quietly underperform a well-chosen ELSS fund by a wide margin, even after accounting for ELSS’s volatility.

A third is assuming NPS’s newly-permitted 80% lump sum is automatically better than 60%. As covered above, the extra 20% currently carries a tax bill the older 60% withdrawal never did, and skipping that math before retirement is an easy way to give back real money.

A fourth, quieter mistake is picking ELSS purely because “it’s the shortest lock-in,” without checking whether a three-year horizon actually suits the goal the money is meant for. A short lock-in that ends in a down market is still a down market — the calendar doesn’t protect you from timing risk the way it protects you from your own impatience.

A fifth is planning a PPF or ELSS contribution around the full ₹1.5 lakh ceiling without first checking how much of it mandatory EPF has already used. It’s an easy number to overlook, since it never shows up as a deliberate “investment decision” the way choosing a fund or opening an account does.

PPF vs ELSS vs NPS: Which One Actually Wins?

There isn’t a single winner, and any comparison of PPF vs ELSS vs NPS that hands you one number as “the answer” is oversimplifying a decision that genuinely depends on your regime, your time horizon, and your tolerance for watching a balance move.

QUICK VERDICT, BY PRIORITY If your single priority is the tax break itself and nothing else, NPS wins — it’s the only instrument with a deduction bucket none of the others can touch. If your priority is capital safety with zero decision-making required, PPF wins, since nothing here is safer or simpler. If your priority is liquidity and growth potential, ELSS wins, by a wide margin, on both counts.

Most people who’ve actually worked through their own regime, horizon, and risk tolerance end up using two of the three, or all three, rather than picking one and walking away. covers how to think about tax-saving investments as part of a wider financial plan, if you’re building that fuller picture from scratch.

Whichever combination you land on, the practical next step is the same: check your current-year Section 123 room against any EPF already deducted, confirm your regime choice for the year, and only then decide how much goes where — in that order, not the reverse.

How to Actually Open Each Account

Opening any of the three is simpler than the tax rules around them suggest. A PPF account can be opened online through most major banks’ net-banking portals, or in person at a post office or bank branch, with basic KYC — PAN, address proof, and a passport-style photo. Most banks let you fund it the same day through net banking, with no separate demat account required.

ELSS works exactly like any other mutual fund purchase: through the fund house’s own website or app, a registered mutual fund distributor, or an aggregator platform, using PAN and a completed KYC check that most investors already have on file from an earlier fund purchase. No demat account is required to hold ELSS units, though one can be used if you prefer.

NPS requires opening an account through the eNPS portal, a bank, or a registered Point of Presence, which issues a Permanent Retirement Account Number (PRAN) — the identifier that follows you across employers and fund manager changes for as long as the account stays open. Choosing a fund manager and an E/C/G allocation (or auto choice) happens at this stage, and both can be changed later within PFRDA’s permitted limits.

Frequently Asked Questions

What is PPF, ELSS, and NPS in simple terms?

PPF is a government savings account with a fixed interest rate and a 15-year term. ELSS is an equity mutual fund with a 3-year lock-in that qualifies for a tax deduction. NPS is a market-linked retirement account locked in until age 60, with an extra deduction no other instrument offers.

Is NPS safe?

NPS is regulated by the PFRDA and invested through licensed pension fund managers, so it carries low regulatory and default risk — there’s no equivalent of a bank run or an AMC shutting down and taking your money with it. Its returns are market-linked, though, meaning your corpus can fall in value in a bad year, especially with a higher equity allocation. Safety here means “well-governed,” not “guaranteed,” which is a different promise than PPF makes.

Can I lose money in ELSS?

Yes. ELSS invests primarily in equities, so its value moves with the stock market, and a three-year window can end lower than it started, especially if that window includes a sharp downturn. The 3-year lock-in doesn’t protect your capital — it only prevents you from selling in a panic before the window closes.

What is the difference between PPF and NPS?

PPF pays a fixed, government-notified interest rate and matures in 15 years, with earlier partial-withdrawal options from year seven. NPS is market-linked, locked in until age 60, and offers an extra ₹50,000 deduction that PPF doesn’t. PPF’s growth is entirely tax-free regardless of regime; NPS’s own-contribution deduction is old-regime-only.

ELSS vs PPF — which is better for tax saving?

Both sit under the same ₹1.5 lakh Section 123 ceiling, so neither gives you more deduction than the other rupee-for-rupee — the difference is what happens to your money after the deduction. ELSS offers a shorter lock-in and higher growth potential with real volatility; PPF offers a fixed, guaranteed return with a much longer commitment.

How many years can I stay invested in NPS?

Your Tier I account stays open until age 60 at minimum. Under current PFRDA rules, you can choose to remain invested and defer withdrawal up to age 75, continuing to benefit from compounding and market exposure throughout that extended window.

Can I invest in PPF, ELSS and NPS in the same year?

Yes, and many people do — there’s no rule against holding all three simultaneously. Just remember that PPF and ELSS draw from the same ₹1.5 lakh Section 123 pool, so investing the full amount in one leaves nothing for the other within that specific ceiling. NPS’s extra ₹50,000 is separate from both and doesn’t share that limit.

What happens to my ELSS and PPF if I switch to the new tax regime?

You stop getting the Section 123 deduction on new contributions going forward, but existing PPF and ELSS holdings aren’t affected retroactively. Your PPF interest stays tax-free, and ELSS units already bought keep their original lock-in and capital-gains treatment. The regime choice only changes what you can newly deduct, not what you already hold.

Which is better for retirement — NPS or PPF?

NPS is purpose-built for retirement, with a lock-in that matches that goal and market-linked growth that has historically outpaced PPF over long periods, though with real year-to-year volatility along the way. It also passes the Regime Survivors Test better than PPF does, thanks to the employer-contribution route. PPF can supplement retirement savings but was never designed as a standalone retirement product, since its 15-year term is shorter than most people’s working life.

Can NRIs invest in PPF, ELSS, or NPS?

NRIs cannot open a new PPF account, though an account opened while resident can run to maturity under specific conditions. NRIs can invest in ELSS through NRE or NRO accounts, subject to fund-house terms, and can open an NPS account as well, though certain withdrawal and repatriation rules differ from those for resident Indians.

How Is Credit Score Calculated? Full Friendly Guide 2026

credit score
WHAT IS A CREDIT SCORE? A credit score is a three-digit number, generated from your credit report, that predicts how likely you are to repay borrowed money on time. In the US, FICO Scores run from 300 to 850; in India, the CIBIL Score runs from 300 to 900. Anyone who has used a credit card, loan, or EMI has one — calculated by a credit bureau, not your bank. Lenders use it to decide whether to approve you and what interest rate to offer. There’s no legal minimum to “have” a score, but most lenders set their own approval cutoffs.

Two people can earn the same salary, hold the same job title, and still get completely different loan offers on the same day. One gets a 9% interest rate; the other gets 14%, or gets turned down outright. The difference usually isn’t their income — it’s a three-digit number neither of them fully understands. That number is built from a handful of specific, mechanical inputs, and once you know what they are, the rest of your credit history stops feeling like a black box.

The Five Things a Score Actually Measures

Credit scoring companies don’t reveal their exact formulas — those are proprietary and closely guarded. But the categories of information that go in, and roughly how much weight each carries, are public. In the US, FICO — used by the large majority of top lenders — groups everything in your credit report into five categories.

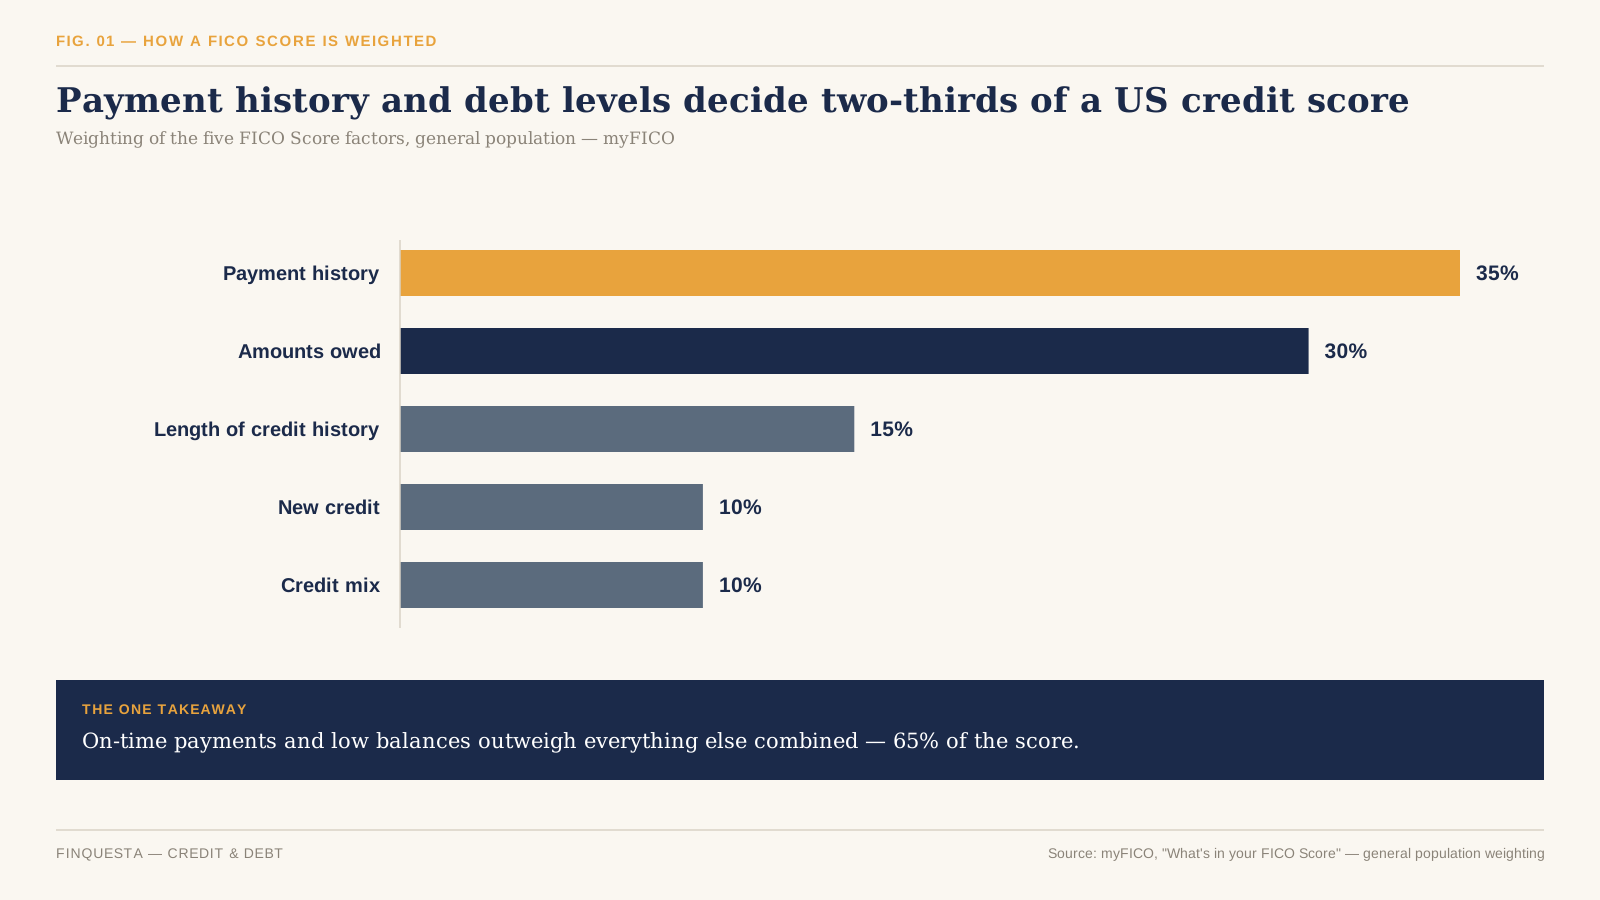
According to myFICO, the consumer arm of the Fair Isaac Corporation, those categories are payment history (35%), amounts owed (30%), length of credit history (15%), new credit (10%), and credit mix (10%) — weightings drawn from the general population and calculated only from data in your credit report, not your income or job.

(FIG. 01): Horizontal bar chart of the five FICO Score factors weighted at 35%, 30%, 15%, 10%, and 10%

Payment History: Worth More Than Everything Else Combined

Payment history is the single largest factor in a FICO Score, and myFICO describes it as the strongest available predictor of whether someone will repay future debts as agreed.

This category looks at whether you’ve paid past accounts — credit cards, retail accounts, installment loans, mortgages — on time. It weighs three things about any late payment: how recent it was, how severe it was (30 days late is treated very differently from 90+ days or a collections account), and how often it’s happened.

Experian notes that a single payment made 30 days or more late can cause significant damage, and that the impact compounds the further behind a borrower falls — with a collections account, foreclosure, or bankruptcy causing even deeper and longer-lasting harm.

The reverse is also true, and less widely understood: one or two old late payments don’t cap your score forever. An otherwise strong track record can outweigh a couple of past mistakes, and the negative weight of an old delinquency fades as it ages further into your history.

Amounts Owed — and the Utilization Snapshot Trap

Amounts owed makes up roughly 30% of a FICO Score, and within that category, credit utilization — the share of your available revolving credit you’re actually using — is the single most influential input.

NerdWallet reports that people with the highest scores tend to keep utilization below 30% of their limit, and often well under 10%.

Here’s the part almost no beginner guide explains clearly: your utilization ratio isn’t based on how much you spent, or even how much you currently owe today. It’s based on the balance your card issuer reported to the bureau on your last statement closing date — a single snapshot, once a month.

myFICO confirms this directly: even if you pay your credit card in full every month, your credit report may still show a balance, because the total on your last statement is generally what gets reported.

Call this the Utilization Snapshot Trap — an original Finquesta framework for a mechanism most articles gloss over. Someone who puts a large one-off purchase on a card, then pays it off completely two weeks later, can still get scored on a high balance if that purchase happened to fall right before the statement date. The fix isn’t complicated once you see it: either pay down the balance before the statement closes, or make a mid-cycle payment so the reported figure is lower — not just the amount you eventually pay off.

Length of Credit History: Why Closing Your Oldest Card Can Backfire

Length of credit history accounts for about 15% of a FICO Score and reflects both how long you’ve had credit overall and the average age of your accounts.

This is why a common piece of advice — “cancel the credit card you don’t use” — deserves a caveat. Closing your oldest account can shorten your average credit age and reduce your total available credit, which can push your utilization ratio up even if your spending hasn’t changed. It’s not an automatic disaster, but it’s a trade-off worth knowing about before you make the call, rather than after your score moves.

New Credit and Credit Mix: The Smaller, Easily Misjudged Factors

New credit and credit mix each carry roughly 10% of a FICO Score.

NerdWallet notes that a hard inquiry — the record left when you apply for new credit — can affect your score for up to six months, though most people see the impact fade well before that.

Credit mix rewards having successfully managed a variety of account types — revolving credit like cards, and installment credit like auto loans or mortgages — rather than only ever having one kind. It’s the smallest factor by weight, which is exactly why opening a loan you don’t need purely to “improve your mix” is rarely worth it: the credit-mix upside is small, and a new hard inquiry works against you in the same breath.

How a CIBIL Score Is Calculated in India

India’s most widely used credit bureau, TransUnion CIBIL, runs on the same underlying logic as FICO but with a different range and, per third-party sources, somewhat different weightings.

TransUnion CIBIL’s own site states that a CIBIL Score is calculated mainly from payment history, credit utilization, age of credit, and enquiries, and ranges from 300 to 900.

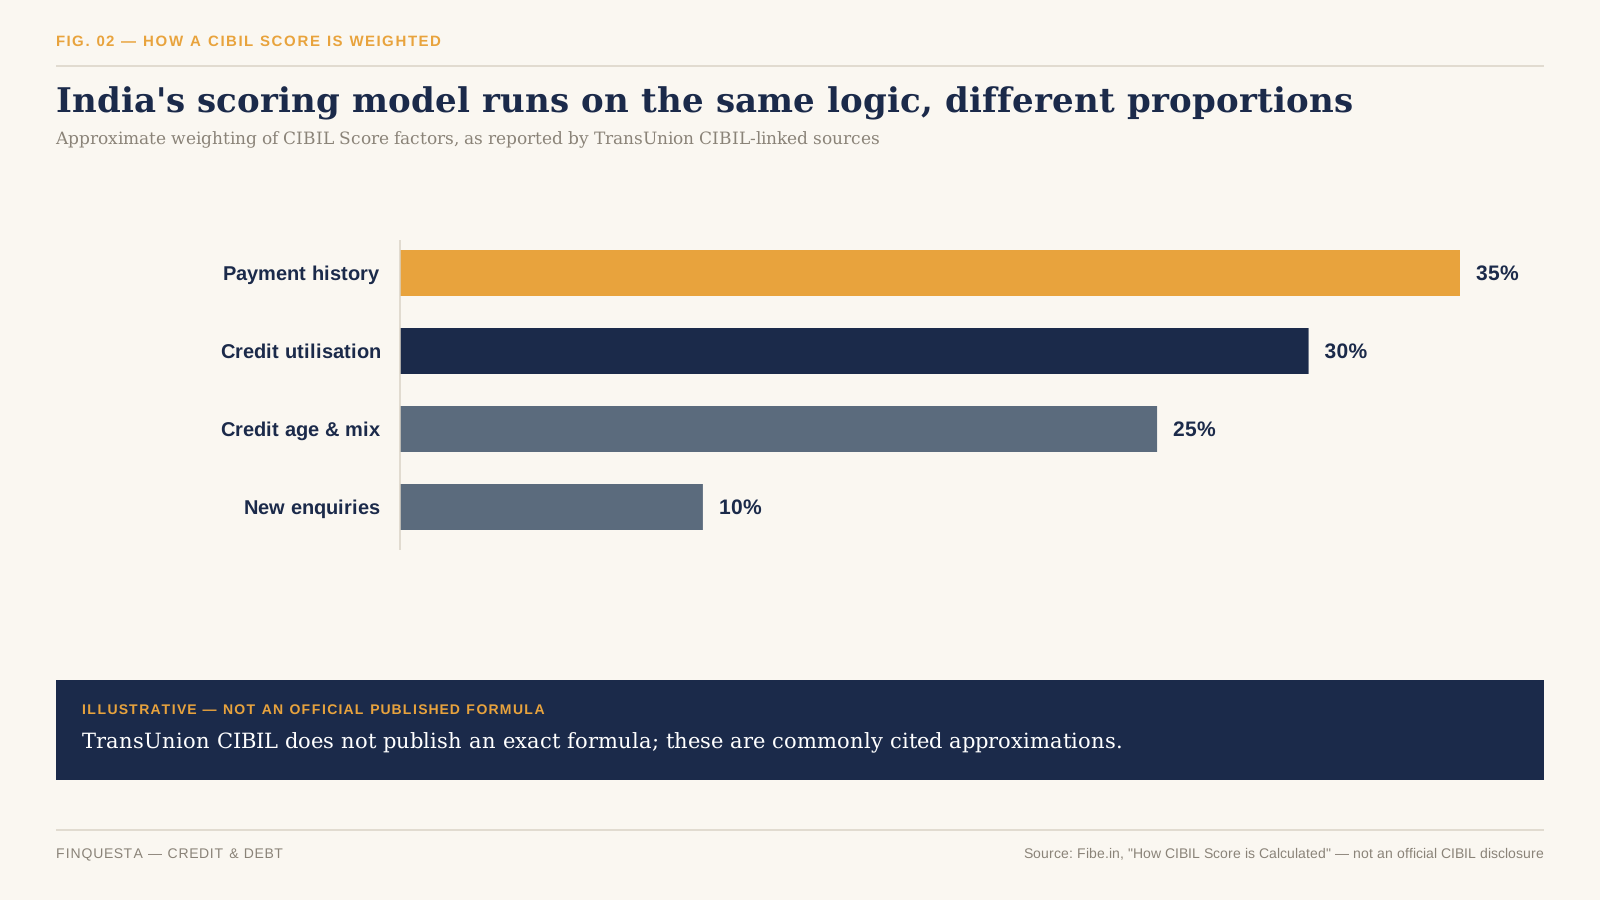
Fibe.in, a lending platform, cites approximate weightings of 35% for payment history, 30% for credit utilization ratio, 25% combined for credit age and credit mix, and 10% for new enquiries — though TransUnion CIBIL does not publish these exact percentages itself.

(FIG. 02): Horizontal bar chart of approximate CIBIL Score weighting: payment history 35%, credit utilisation 30%, credit age and mix 25%, new enquiries 10%

A useful India-specific detail beginner guides tend to skip: TransUnion CIBIL introduced an updated model, CIBIL Score 2.0, that changed what counts as a strong score for borrowers with a short credit history.

Under this newer model, borrowers with more than six months of credit history are still scored from 300 to 900, but the “ideal” range shifted to roughly 662–697, compared with 751–800 under the earlier model — and applicants with under six months of history are instead placed on a separate 1-to-5 risk index.

FICO vs. CIBIL vs. VantageScore: Comparing the Scales

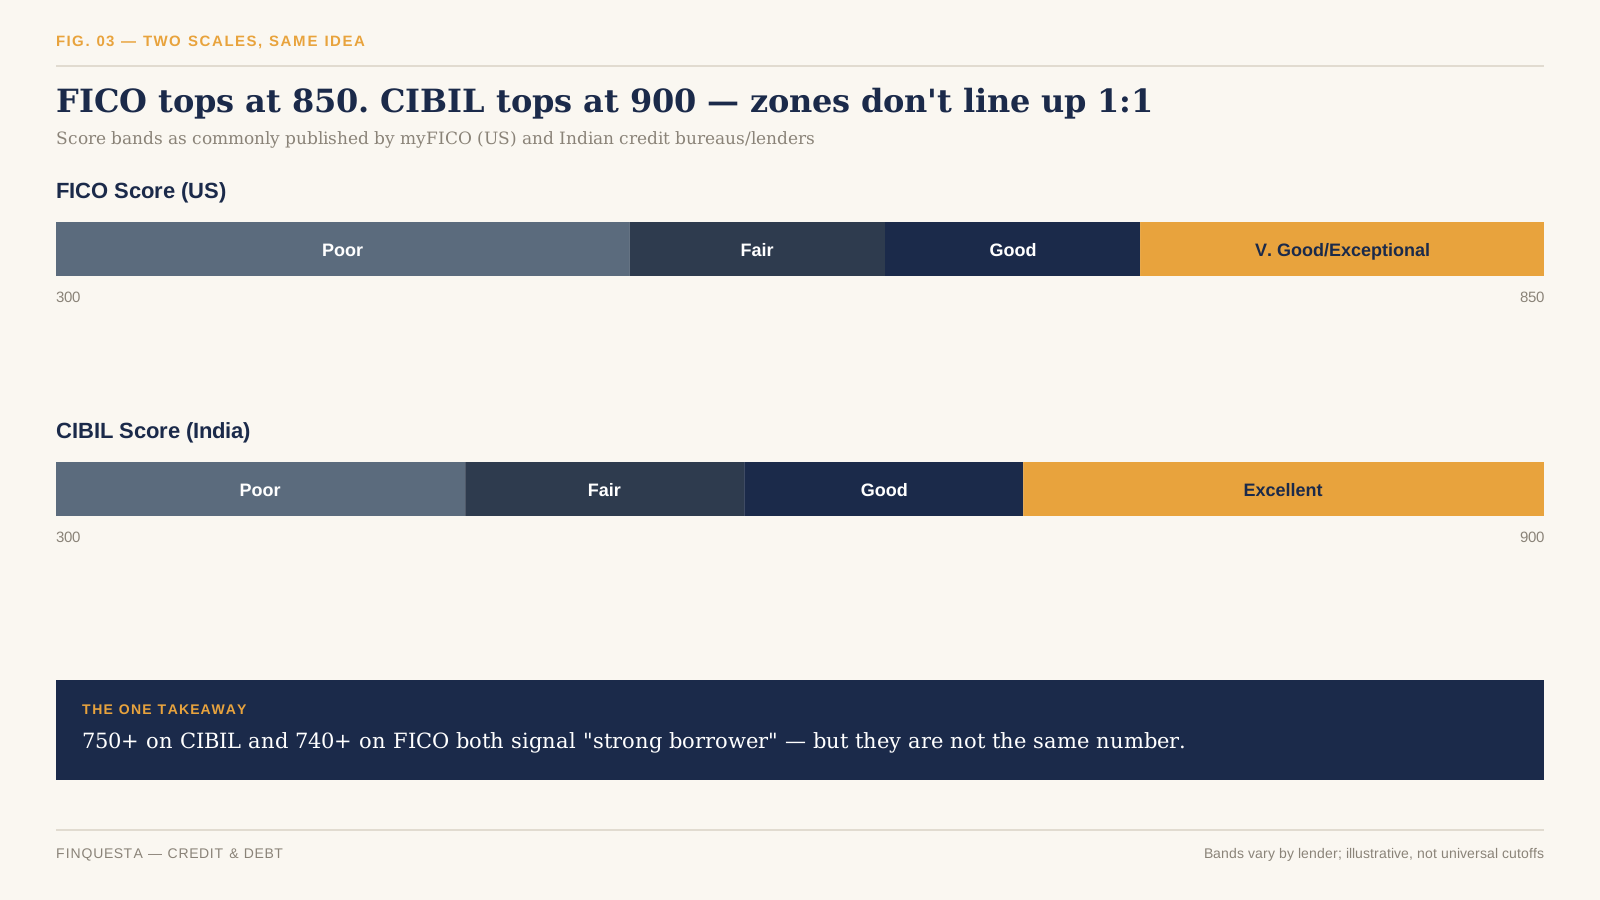
If you’ve ever moved between countries, or compared notes with a friend who scores well abroad, the numbers alone can be misleading. A 750 on CIBIL and a 750 on FICO are not measuring the same 750.

(FIG. 03): Range comparison of FICO score bands from 300 to 850 against CIBIL score bands from 300 to 900

myFICO’s own consumer guidance treats 670 to 739 as a “good” FICO Score, with 740 and above generally considered very good to exceptional.

For CIBIL, a widely cited industry rule of thumb treats scores above 750 as the range most likely to unlock the best interest rates and fastest approvals, based on lender guidance reported by Finnable, an RBI-licensed NBFC.

There’s also a third model worth knowing: VantageScore, jointly developed by the three major US bureaus as a FICO alternative.

NerdWallet reports that FICO and VantageScore use the same broad set of factors but weight them differently — payment history is 35% of a FICO Score but about 40% of a VantageScore — which is one reason your FICO and VantageScore numbers can differ even when pulled from the exact same credit report.

None of this means the scores disagree about who you are as a borrower — they’re built from similar raw material and tend to move in the same direction. The gap matters mainly when you’re comparing a number against a threshold: “is 700 good?” only makes sense once you know which scale you’re standing on.

The Score Refresh Lag: Why Your Score Doesn’t Update Instantly

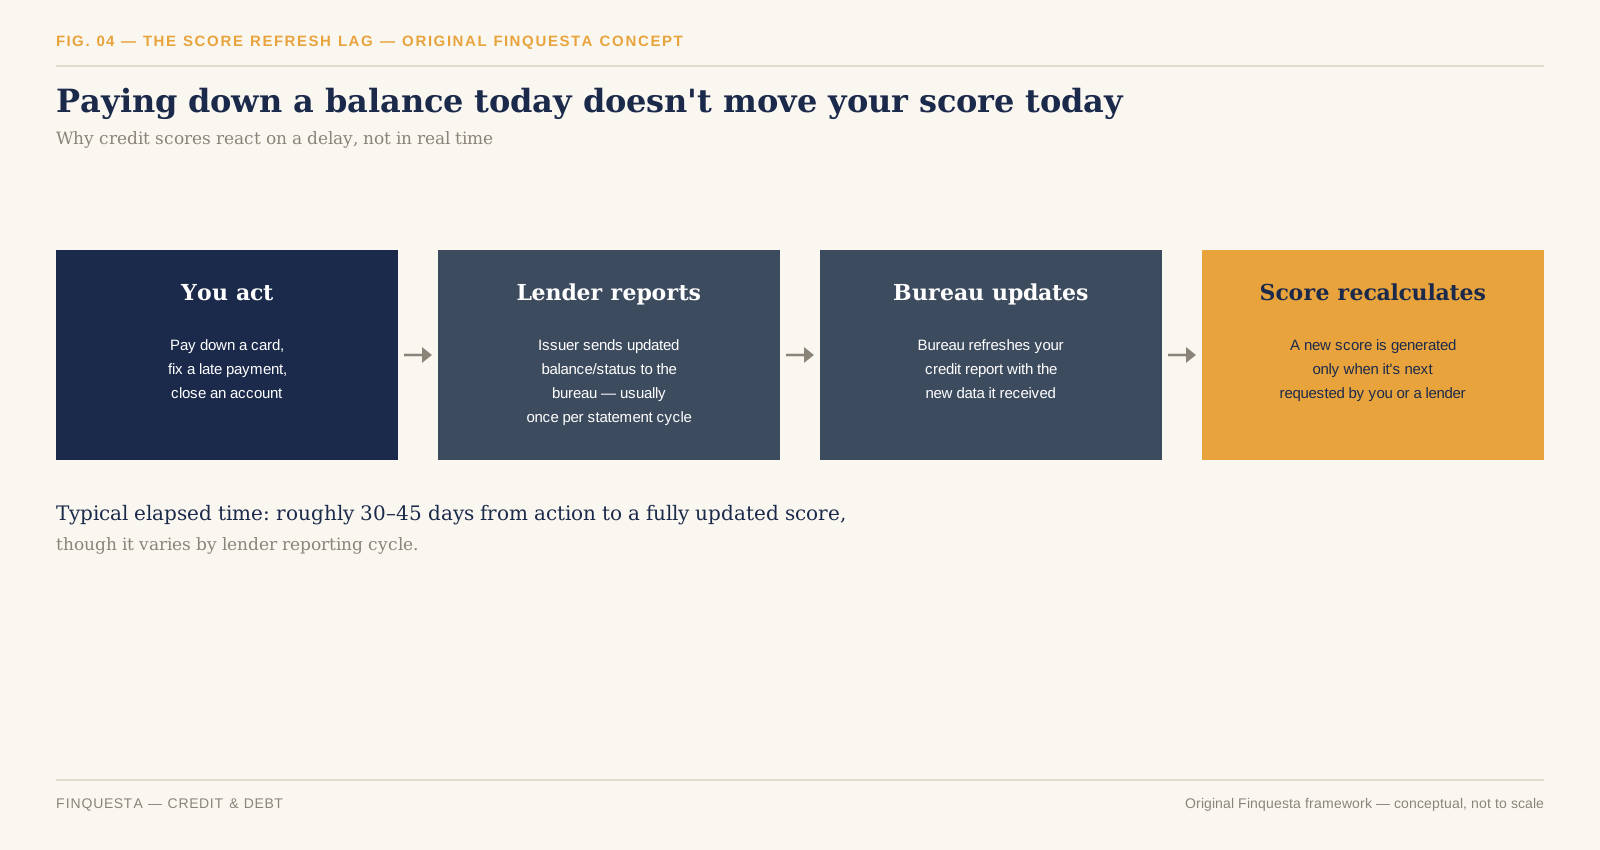
Pay off a credit card balance today, and it’s tempting to check your score tomorrow expecting a jump. It usually isn’t there yet — and this is the second original framework worth naming here: the Score Refresh Lag.

A score doesn’t recalculate the moment your bank account changes. It moves through a short chain: you act, your lender reports that action to the bureau (typically once per statement cycle, not in real time), the bureau updates your file, and only then — the next time your score is actually requested — does a new number get generated.

(FIG. 04): Four-step flow diagram showing the Score Refresh Lag: you act, lender reports, bureau updates, score recalculates

The practical takeaway isn’t that paying down debt doesn’t work — it’s that the timing of a score check matters. If you’re managing your score ahead of a specific application (a mortgage, a car loan), the Score Refresh Lag means the moves that matter most need to happen well before you actually apply, not the week of.

Why You Don’t Have Just One Credit Score

The debt-focused financial education site debt.org notes that scores can vary by as much as 40 points between bureaus, because lenders don’t always report to every bureau, and each bureau’s model weighs the same information slightly differently.

In India, TransUnion CIBIL is one of four licensed credit bureaus — alongside Experian, Equifax, and CRIF High Mark — and a borrower can hold meaningfully different scores across them at the same time, reflecting different algorithms and reporting timelines rather than an error in any one report.

This is also why the score a free app shows you and the score your mortgage lender pulls can genuinely differ. Neither is necessarily “wrong” — they’re different models, sometimes built from different bureau data, occasionally pulled on different days within the same reporting cycle.

What Actually Moves the Needle

Given the weightings above, a handful of habits do most of the work, in roughly this order of impact:

  • Pay every account on time, every cycle — this is the single largest lever on both FICO and CIBIL models.
  • Keep credit utilization low relative to your limit, and remember the Utilization Snapshot Trap: what matters is the balance on your statement date, not what you eventually pay off.
  • Avoid closing your oldest active account purely for convenience, since it can shorten your average credit age.
  • Space out new credit applications rather than applying for several cards or loans in a short window.
  • Check your own credit report periodically for errors — a wrong balance or an account that isn’t yours can drag a score down for reasons that have nothing to do with your actual behavior.

None of this is a guarantee of a specific score outcome, and no legitimate service can promise one — anyone claiming to erase accurate negative history overnight is not describing how these systems work.

Common Myths About Credit Scores

“Checking my own score hurts it.”

Checking your own score is a soft inquiry and, per FICO’s own scoring guidance and consumer education sources like MyCreditUnion.gov, does not affect your score at all — only hard inquiries from an actual credit application do that, and even then the effect is typically small.

“Carrying a small balance builds credit faster than paying in full.”

This isn’t supported by how utilization is scored. Paying your statement balance in full each month, and letting the low resulting figure get reported, works at least as well as carrying a balance — and it also means you’re not paying interest.

“A good income guarantees a good score.”

Income isn’t part of the score calculation at all in either the FICO or CIBIL models described above — the score is generated purely from data in your credit report. A high earner with erratic payment history can score lower than a modest earner with a spotless one.

Frequently Asked Questions

What is a good credit score?

On the FICO scale, myFICO generally treats 670–739 as good and 740+ as very good to exceptional; on the CIBIL scale, 750 and above is commonly treated by Indian lenders as the range that unlocks the best rates.

How is credit score calculated, in simple terms?

It’s calculated by a credit bureau’s proprietary formula applied to your credit report — mainly your payment history and how much of your available credit you’re using, with smaller contributions from how long you’ve had credit, how much new credit you’ve recently sought, and the variety of credit types you hold.

Is checking my credit score safe?

Yes — checking your own score is a soft inquiry and doesn’t affect your score, whether you check it through a bank app, a free credit-monitoring service, or directly through the bureau.

Can I lose points just for applying for a new credit card?

Yes, modestly — a hard inquiry from a new application can affect your score, with NerdWallet noting the impact can linger for up to six months, though it’s typically a small dip that fades faster than that for most applicants.

What is the difference between a FICO Score and a CIBIL Score?

They’re built on similar underlying logic but different scales and, per available sourcing, somewhat different factor weightings: FICO runs 300–850 and is used primarily in the US; CIBIL runs 300–900 and is the most widely referenced score among Indian lenders.

FICO vs. VantageScore — which one will my lender use?

It depends entirely on the lender — some pull FICO, some pull VantageScore, and larger lenders sometimes pull both. There’s no way to know for certain which one a specific lender will check without asking them directly.

How many credit accounts should I have?

There’s no fixed number that works for everyone. What matters more than the count is whether every account you do have is paid on time and kept at a reasonable utilization level — a thin file managed well can outperform a thick file managed poorly.

Does my salary affect my credit score?

No — income is not a scoring input in either the FICO or CIBIL models described in this article. Lenders may separately ask about your income when deciding whether to approve a loan, but that’s an underwriting decision layered on top of the score, not part of how the score itself is calculated.