
Most people who tell you they want to “invest in the stock market” are actually describing something closer to trading — checking prices daily, reacting to news, hoping to catch a move within weeks rather than years. Confusing the two isn’t a semantic slip. It’s the single biggest reason beginner trading accounts in India go quiet, or empty, within twelve months of being opened.
This guide is written for the second group — the ones who actually mean trading. It covers what you legally need before your first order, how to read a chart well enough not to be dangerous to yourself, what a trade really costs after brokerage and tax, and the discipline habits that separate people who last from people who don’t.
Table of Contents
What Is Stock Trading, Really?
Stock trading is buying and selling shares of listed companies over a short holding period — anywhere from a few seconds (intraday) to a few weeks (swing trading) — aiming to profit from price movement itself, not the company’s long-term growth. Anyone with a demat account, a trading account, and capital can do it. In India, trading is regulated by the Securities and Exchange Board of India (SEBI), and every share you hold sits in your name at a depository — NSDL or CDSL — which is what actually protects your holdings if your broker runs into trouble.
That single fact — your shares live at the depository, not with your broker — is worth sitting with for a second, because it answers the question most beginners are actually too embarrassed to ask before they open an account: what happens to my money if the broker shuts down. Your cash balance is a different story, which is exactly why the next section exists.
Trading vs Investing: The Difference That Decides Whether You’ll Actually Succeed
Trading and investing use the same app, the same exchange, and often the same stock. That’s exactly why beginners blur them — and why blurring them is expensive. An investor buying Reliance Industries for a ten-year holding period doesn’t care that the stock dropped 3% on results day. A trader holding the same stock overnight cares enormously, because 3% might be their entire risk budget for the week.
Here’s a simple, original framework worth actually using before you place a single order — call it the Time Horizon Test (Original Finquesta framework). Ask yourself three questions about the position you’re about to open:
- What’s your exit trigger — a specific price target or date, or “whenever I need the money someday”?
- What are you actually evaluating — the chart’s pattern, or the company’s balance sheet and management?
- If this position dropped 15% tomorrow morning, would your first move be to check the news, or check your stop-loss?
Two or more answers landing on the first option in each pair means you’re trading, whether you call it that or not — so act like it: use a stop-loss, size the position small, and expect to be wrong close to half the time and still come out ahead on the trades that work. Two or more answers landing on the second option means you’re investing, in which case a single day’s price move barely matters, and a demat account full of trading-app habits (checking it four times an hour) will only cost you sleep and impulsive decisions.
If, honestly, the Time Horizon Test points you toward investing rather than trading, the lower-effort starting point is a systematic monthly investment into a diversified mutual fund rather than picking individual stocks — Finquesta’s guide on how a mutual fund actually works and how to start one walks through that path in full.This guide, from here on, is written for the trading path specifically.
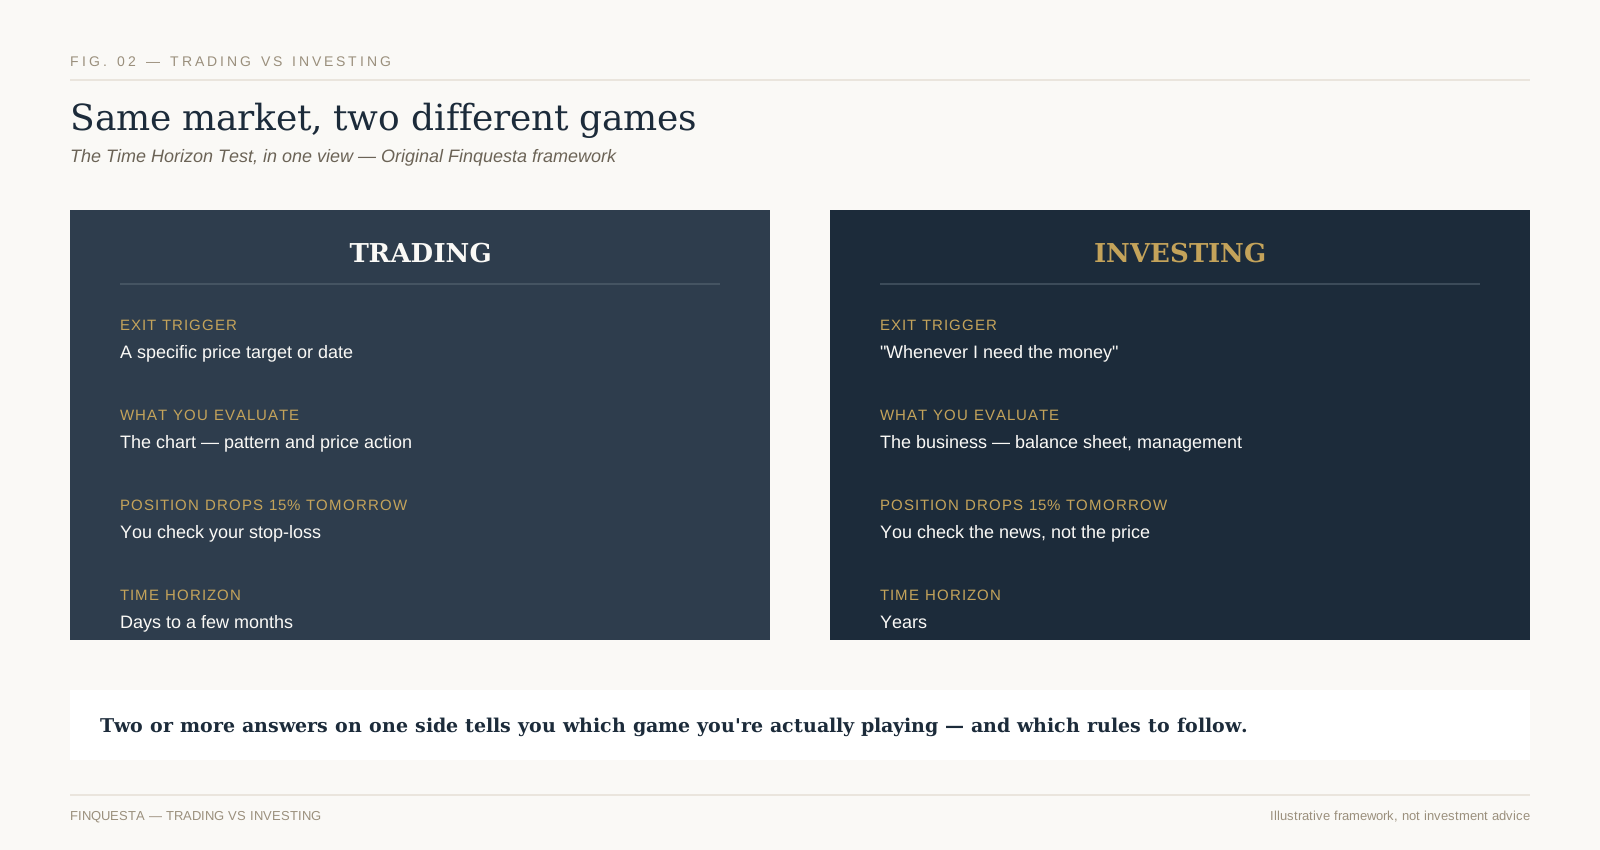
Fig. 02 — Trading vs investing, compared across exit trigger, evaluation method, and reaction to a 15% drop
How to Start Trading in India: What You Need Before Your First Trade
Three things stand between you and your first order, and none of them are optional.
A PAN card. Every demat and trading account in India is linked to a Permanent Account Number — no PAN, no account, no exceptions, because SEBI requires it for KYC and tax reporting.
A demat account. This is where your shares are held electronically, maintained by a Depository Participant (DP) that’s registered with NSDL or CDSL. Think of it as a bank account, except it holds securities instead of cash.
A trading account. This is the account that actually places buy and sell orders on the exchange — the National Stock Exchange (NSE) or Bombay Stock Exchange (BSE). Your demat account stores what you own; your trading account is how you buy and sell it.
Most brokers today bundle demat and trading into a single “2-in-1” account opened through one online application, so in practice this is one sign-up flow, not three separate ones. You’ll also need a linked bank account for the money to move in and out of, and a mobile number and email registered for OTP-based verification — SEBI’s KYC rules require your identity to be independently verifiable, not just self-declared on a form.
How to Open a Demat and Trading Account in India: Step by Step
The account-opening process itself is almost entirely digital now, and takes most people under thirty minutes if their documents are in order.
Step 1 — Choose a broker. More on how to actually pick one in the next section; for now, know that SEBI-registered brokers all offer largely the same account-opening flow.
Step 2 — Complete e-KYC. You’ll enter your PAN, and the broker verifies it against government records. Aadhaar-based e-KYC, where available, can auto-fill most of your personal details from UIDAI’s records, which is what makes the process fast.
Step 3 — Upload documents. A PAN card copy, an address proof (Aadhaar, passport, voter ID, or a recent utility bill), a cancelled cheque or bank statement for account linking, and a passport-size photo. Most brokers accept phone-camera scans.
Step 4 — In-Person Verification (IPV). SEBI requires a video KYC step — a short live video call or recorded selfie-video confirming you’re a real person matching your documents, not a stolen identity opening an account.
Step 5 — E-sign the account opening agreement. This is done via Aadhaar-linked e-signature (OTP-based), replacing the paper signature process that used to take days.
Step 6 — Fund your account and place your first trade. Once approved — typically same-day to 48 hours — you transfer funds via UPI or net banking, and your trading account is live.
Choosing a Broker: What Actually Matters
The full-service versus discount broker decision gets presented as a beginner’s first big choice, and it’s simpler than it’s made out to be. A full-service broker (typically a bank-affiliated one) bundles research reports, relationship-manager access, and advisory calls into a higher brokerage fee — often a percentage of trade value. A discount broker charges a flat fee per executed order, sometimes near-zero for delivery trades, and gives you the trading platform without the advisory layer.
For a beginner trading their own capital in small size, the maths almost always favours a discount broker: on a modest trade size, a percentage-based brokerage from a full-service broker can eat a meaningfully larger share of your position than a flat ₹20 (or lower) per order. The “research and advice” a full-service broker sells is also something this guide — and Finquesta generally, per Rule 3 of our own editorial policy — won’t substitute with a stock tip either, because the honest answer is that you should be able to explain why you’re in a trade without outsourcing that judgment to anyone’s call.
What genuinely matters more than the full-service/discount label: uptime and order-execution speed during volatile market opens (a platform that lags for ninety seconds at 9:15 AM can cost you more than a year of brokerage savings), the quality of the charting tools built into the app, how clearly the broker discloses charges up front, and whether customer support actually answers when your order is stuck. Read the last three months of app-store reviews before you read a comparison article — including this one.
How to Start Trading in India: Your First 6 Steps
Once your account is live, here’s the sequence that keeps a first trade from becoming an expensive lesson.
1. Fund a small, specific amount — not “whatever’s spare.” Decide the rupee amount you’re willing to lose completely without it affecting your life, and start with that, not your full available capital.
2. Pick one stock you can actually explain. Not a tip from a group chat — a company whose business model you could describe to a friend in two sentences. If you can’t, you’re not ready to size a position in it.
3. Check the chart before you check the price. A stock trading near a level it’s failed at three times before is telling you something a headline won’t. (More on this in the candlestick sections below.)
4. Choose your order type deliberately — not whatever the app defaults to. The next section covers why this single choice is where most beginner losses actually originate.
5. Set your stop-loss the moment you enter, not after the trade starts moving against you. A stop-loss decided in advance is a plan; a stop-loss decided while watching the price fall is usually a rationalisation.
6. Log the trade — entry price, exit price, and the reason you took it — win or lose. This single habit, more than any indicator, is what turns a string of random outcomes into an actual improving process.
Understanding Order Types: Market, Limit, and Stop-Loss
The order type you pick is not a technicality — it’s the single most common place a beginner loses money before the market even moves against them.
A market order executes immediately at the best available price. It guarantees execution, not price — in a fast-moving or thinly traded stock, the price you actually get can differ meaningfully from the price you saw on screen a second earlier. This gap is called slippage, and it’s the quiet tax new traders pay without realising it.
A limit order executes only at your specified price or better. You control the price; you give up the guarantee of execution — your order might simply never fill if the stock never reaches your level.
A stop-loss order sits dormant until the price hits a trigger you set, at which point it converts into a market (or limit) order to exit the position. This is the single most under-used order type among beginners, and the most important one: it’s what makes “I’ll get out if it goes wrong” an actual instruction to the exchange instead of a promise to yourself that panic overrides.
The beginner mistake worth naming directly: placing a market order to enter a volatile, low-liquidity small-cap stock right at market open. Spreads are widest and slippage is worst in the first few minutes of trading, precisely when beginners — excited to place their first order — are most likely to click buy.
How to Read a Stock Chart Before You Trade It
Every price chart is a record of a negotiation — buyers and sellers disagreeing about what a stock is worth, with price as the running scoreboard. Most beginners look at a chart and see a random squiggly line. Traders who last look at the same chart and see a story about who’s currently winning that negotiation, one candle at a time.
Before candlesticks specifically, two things worth knowing about any chart: the timeframe (a 5-minute chart and a weekly chart of the same stock can look like they’re describing two different companies — always check which one you’re looking at), and the volume bars usually printed beneath the price, which tell you how much conviction is behind a given move. A price breakout on low volume is a much weaker signal than the identical breakout on volume triple the recent average.
How to Read Candlestick Charts: The Anatomy of a Single Candle
A candlestick chart looks intimidating the first time you see one — a wall of red and green rectangles that reads like nothing at all. Once you know what a single candle is actually recording, that wall turns into a fairly simple story about who won each round: buyers or sellers.
Each candle represents one fixed period of time (a minute, an hour, a day — set by the chart’s timeframe) and records four numbers: the open (price when the period started), the close (price when it ended), the high (the peak reached), and the low (the trough reached). The thick rectangular part is called the body — it spans from the open to the close. The thin lines above and below the body are the wicks (or shadows) — they mark the high and low, the furthest the price reached before pulling back.
Colour tells you direction at a glance. A green (or unfilled/white) candle means the close was higher than the open — buyers won that round. A red (or filled/black) candle means the close was lower than the open — sellers won. A long body means one side dominated the entire period with conviction; a short body with long wicks on both ends means a genuine tug-of-war, with neither side able to hold control by the close.
This is the entire vocabulary a candlestick chart is written in. Everything else — every named pattern — is just a specific, recognisable arrangement of these same four numbers repeating in a way traders have learned to recognise.
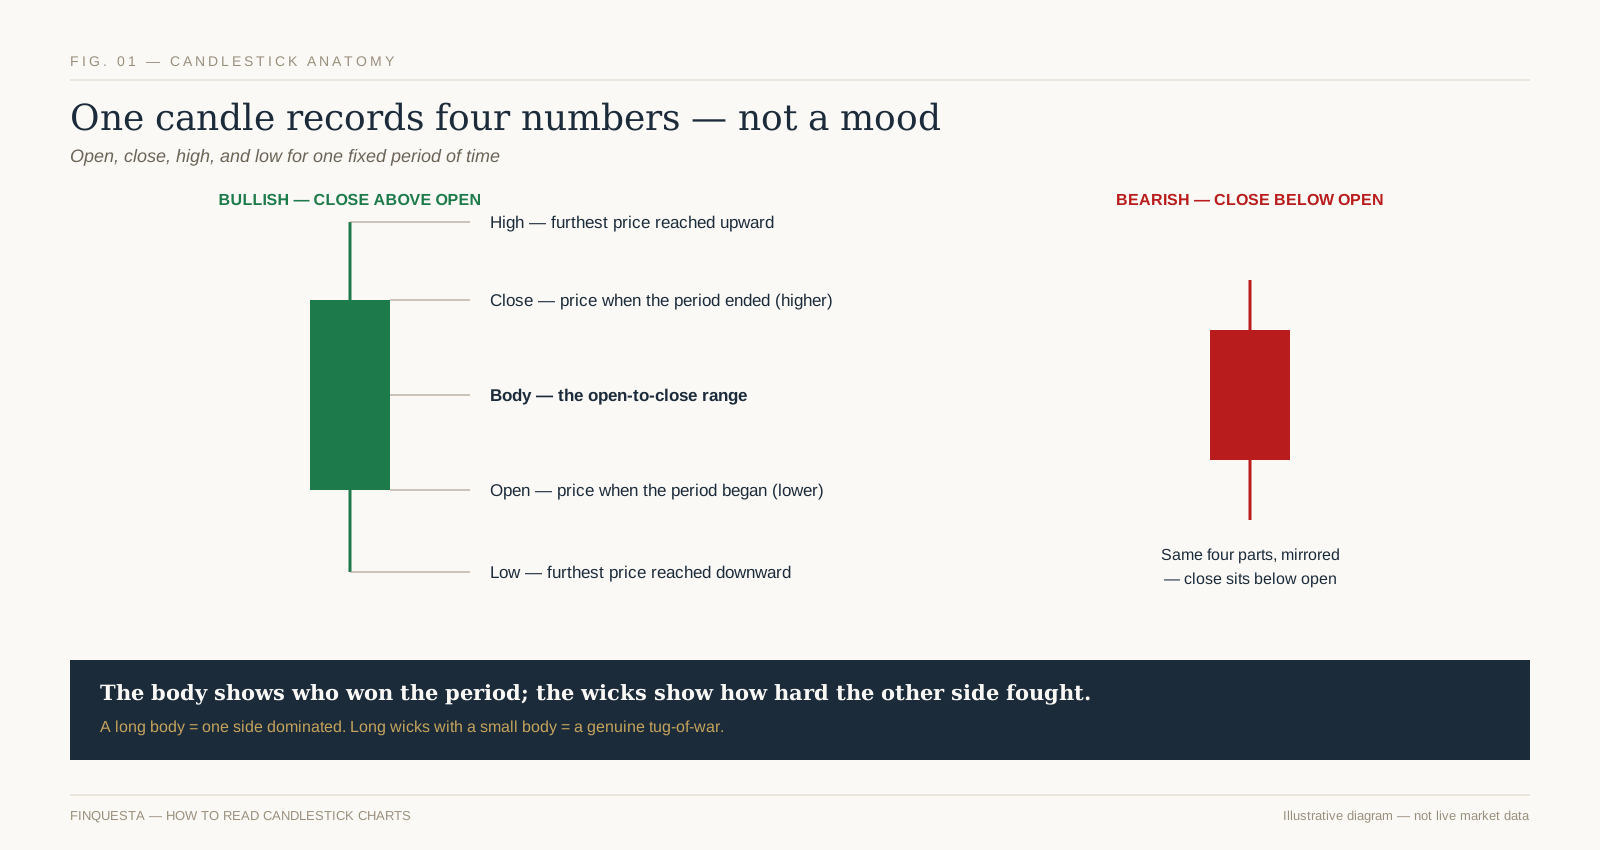
Fig. 01 — A single candle’s anatomy: open, close, high, low, body, and wick
Five Candlestick Patterns Worth Actually Knowing as a Beginner
Trading blogs love listing forty candlestick patterns. In practice, a beginner who deeply understands five will out-trade someone who’s memorised forty without understanding any of them, because pattern recognition without context is just superstition with better branding.
The Doji. Open and close are nearly identical, producing a candle that’s almost all wick and barely any body. It signals indecision — neither buyers nor sellers won this round — and is far more meaningful after a strong trend than in the middle of a sideways, directionless stretch.
The Hammer. A small body near the top of the candle’s range, with a long lower wick — at least twice the body’s length — and little to no upper wick. After a downtrend, it suggests sellers pushed price down hard during the period, but buyers stepped in and dragged it back up before the close. On its own it’s a hint, not a signal; traders typically wait for the next candle to confirm before acting on it.
The Shooting Star. The Hammer’s mirror image — a small body near the bottom, a long upper wick, appearing after an uptrend. It suggests buyers pushed price up, but sellers overwhelmed them before the close, and is read as a possible reversal signal in the opposite direction from the Hammer.
The Bullish Engulfing pattern. A two-candle pattern: a small red candle followed by a larger green candle whose body completely “engulfs” the prior candle’s body, top to bottom. It suggests a decisive shift in control from sellers to buyers within a single period.
The Bearish Engulfing pattern. The mirror image — a small green candle followed by a larger red candle that fully engulfs it, suggesting sellers just took decisive control from buyers.
The honest caveat every credible source should give you and most don’t: no candlestick pattern is a reliable signal in isolation. Professional traders use them alongside volume, support/resistance levels, and the broader trend — never as a standalone trigger to place a trade. Treat this section as vocabulary, not a system.
Intraday Trading vs Delivery Trading vs F&O: Picking Your Lane
Delivery trading means you buy shares and they land in your demat account — you can hold them for a day, a month, or a decade, and you owe nothing until you sell. It’s the lowest-pressure way to trade, since there’s no same-day deadline forcing a decision.
Intraday trading means you buy and sell (or sell and buy — “short selling”) the same stock within the same trading session, closing the position before the market shuts, without ever taking delivery into your demat account. It typically uses leverage the broker extends for the day, which magnifies both gains and losses, and it’s taxed differently, which the tax section below covers in detail.
Futures & Options (F&O) trading uses derivative contracts whose value is based on an underlying stock or index, rather than the stock itself. It offers the highest leverage of the three — and correspondingly the highest capacity to lose money fast, including in some structures, more than your original capital. SEBI has progressively tightened F&O eligibility and lot-size rules in recent years specifically because retail losses in the segment have been so heavily skewed negative.
For a genuine beginner, delivery trading is the only one of the three with no clock forcing a decision — which makes it the only one where a first mistake is a learning experience rather than a same-day margin call. Intraday and F&O are not “more advanced versions of the same thing you should graduate into” — they’re structurally different risk instruments, and treating them as a natural next step rather than a deliberate, separate decision is exactly how disciplined delivery traders end up in F&O positions they don’t understand.
How Much Money Do You Actually Need to Start Trading in India?
There’s no SEBI-mandated minimum capital to open a demat and trading account, and several brokers let you place your first delivery trade with capital in the low hundreds of rupees, since Indian equities can be bought in single shares rather than fixed lot sizes (unlike F&O, which trades in exchange-defined lot sizes).
The more useful question than “what’s the minimum” is “what makes practising worthwhile.” An amount too small to notice losing teaches you nothing about your own discipline under pressure — the entire point of starting small is to make mistakes that sting just enough to be memorable, without being financially serious. A starting amount you could comfortably lose entirely and still meet next month’s expenses without stress is the right test, not any specific rupee figure a blog gives you.
The Real Cost of Trading: Brokerage, STT, and Other Charges
Every trade costs more than the brokerage fee your app shows you upfront, and understanding the full stack is what separates a trader who tracks real profitability from one who’s quietly losing money to charges while feeling like they’re breaking even.
Brokerage. What your broker charges per order — either a flat fee or a small percentage of trade value, capped at a flat maximum by most discount brokers.
Securities Transaction Tax (STT). A tax the government charges automatically at the time of the trade — you don’t calculate or pay it separately; it’s deducted in the contract note. According to Zerodha’s published rate table (current from 1 April 2026, following the Budget 2026–27 revision), STT on equity delivery trades is 0.1% of trade value on both the buy and sell side; on equity intraday trades it’s 0.025% of trade value on the sell side only; and on F&O, futures carry 0.05% on the sell side while options carry 0.15% of either the premium (when sold) or the intrinsic value (when exercised) — all of which rose from the pre-April-2026 rates as part of that Budget’s F&O tax changes.
Exchange transaction charges, SEBI turnover fees, stamp duty, and GST on brokerage. Individually small, collectively real — a full, current breakdown lives on your broker’s own charges page, since exact per-segment figures shift periodically and your broker’s contract note is the authoritative record for what you actually paid.
Depository Participant (DP) charges. A per-scrip charge levied by your DP each time you sell shares out of your demat account (delivery trades only) — separate from brokerage, and easy to forget when estimating a trade’s true cost.
The habit worth building from week one: check your contract note after every trade, not just your profit-and-loss number. A trade that looks like a small win on the price chart can be a net loss once every charge above is subtracted — and you’ll never know that if you’re only ever looking at the price.
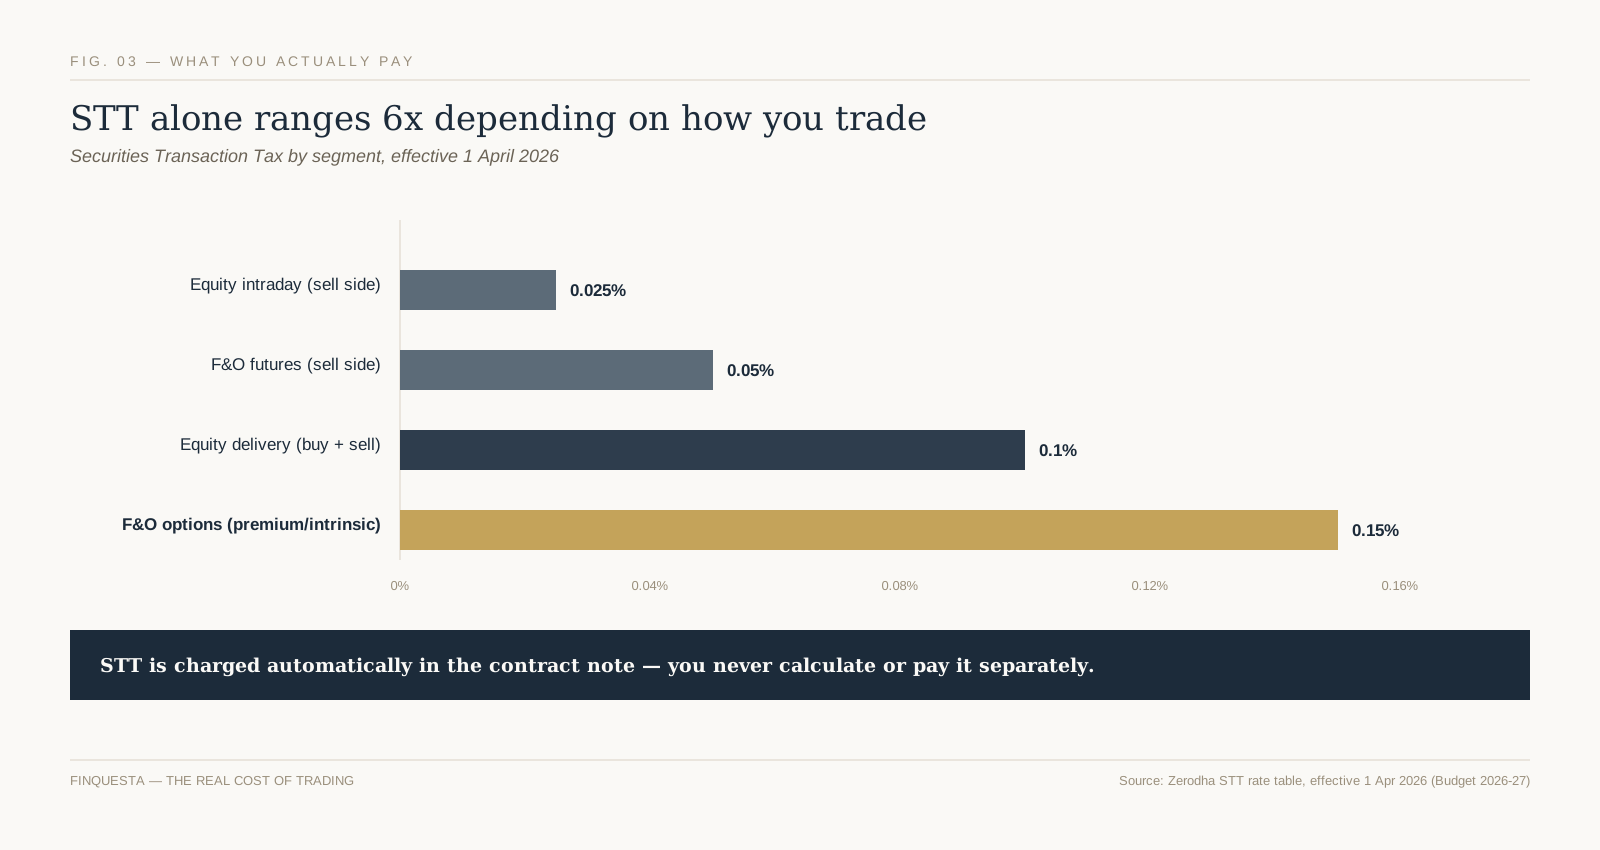
Fig. 03 — Securities Transaction Tax by trading segment, effective 1 April 2026
Taxation on Trading Gains in India
This is a section beginners either skip entirely or get wrong in the same predictable way — treating all trading profit as one tax category, when India’s rules split it into genuinely different treatments depending on what kind of trading you did.
Delivery-based trades held over 12 months are taxed as long-term capital gains (LTCG) on listed equity. Delivery-based trades held under 12 months are taxed as short-term capital gains (STCG). Both have specific rates and thresholds set by the current Finance Act, which change with the annual Union Budget — always confirm the figure in effect for the financial year you’re filing before relying on it.
Intraday trading profit is treated entirely differently — not as a capital gain at all, but as speculative business income under Section 43(5) of the Income Tax Act, because you never actually took delivery of the shares. This means it’s taxed at your applicable income-tax slab rate — the same slabs your salary is taxed under — rather than at a flat capital-gains rate, and it’s reported under “Profits and Gains from Business or Profession” on your return, not the capital gains schedule. One rule worth knowing before it costs you a refund: speculative losses can only be set off against speculative gains — not against your salary, other business income, or capital gains from delivery trades — though they can be carried forward for four assessment years if you file your return by the due date.
F&O trading profit is also treated as business income (non-speculative, unlike intraday equity), taxed at slab rate, with its own tax-audit threshold rules depending on turnover.
None of this is a substitute for a chartered accountant once your trading activity is non-trivial — it’s the mental model you need to understand what your CA is actually calculating, and to know which documents (contract notes, the year’s P&L statement from your broker) you need to hand over at filing time.
Risk Management: The Discipline Most Beginners Skip
Every trading guide mentions risk management in a paragraph and moves on. It deserves more than that, because it’s the actual difference between traders who are still trading in three years and the much larger group who aren’t.
Position sizing comes first: never risk more on a single trade than you’re prepared to lose on several trades in a row, because you will lose several in a row — that’s not pessimism, it’s the base rate for anyone trading with a real edge, let alone without one. A common starting discipline is risking no more than 1-2% of total trading capital on any single position’s stop-loss distance, which means a string of five consecutive losses costs you 5-10% of capital, not 50%.
Here’s a second original framework worth adopting outright: the Two-Loss Rule (Original Finquesta framework). After two consecutive stop-losses are hit in the same trading session, you stop trading for the day — full stop, no exceptions, no “one more trade to win it back.” This single rule exists because the psychological state after two losses in a row — the urge to immediately recover the loss — is precisely the state in which traders abandon their own plan and take a third, oversized, poorly-reasoned trade. The Two-Loss Rule isn’t about the third trade being statistically doomed; it’s about removing your own judgement from the decision at the exact moment it’s least trustworthy.
Journaling every trade, mentioned earlier in the six-step sequence, is what makes both of these rules enforceable over time rather than good intentions you abandon after a good week.
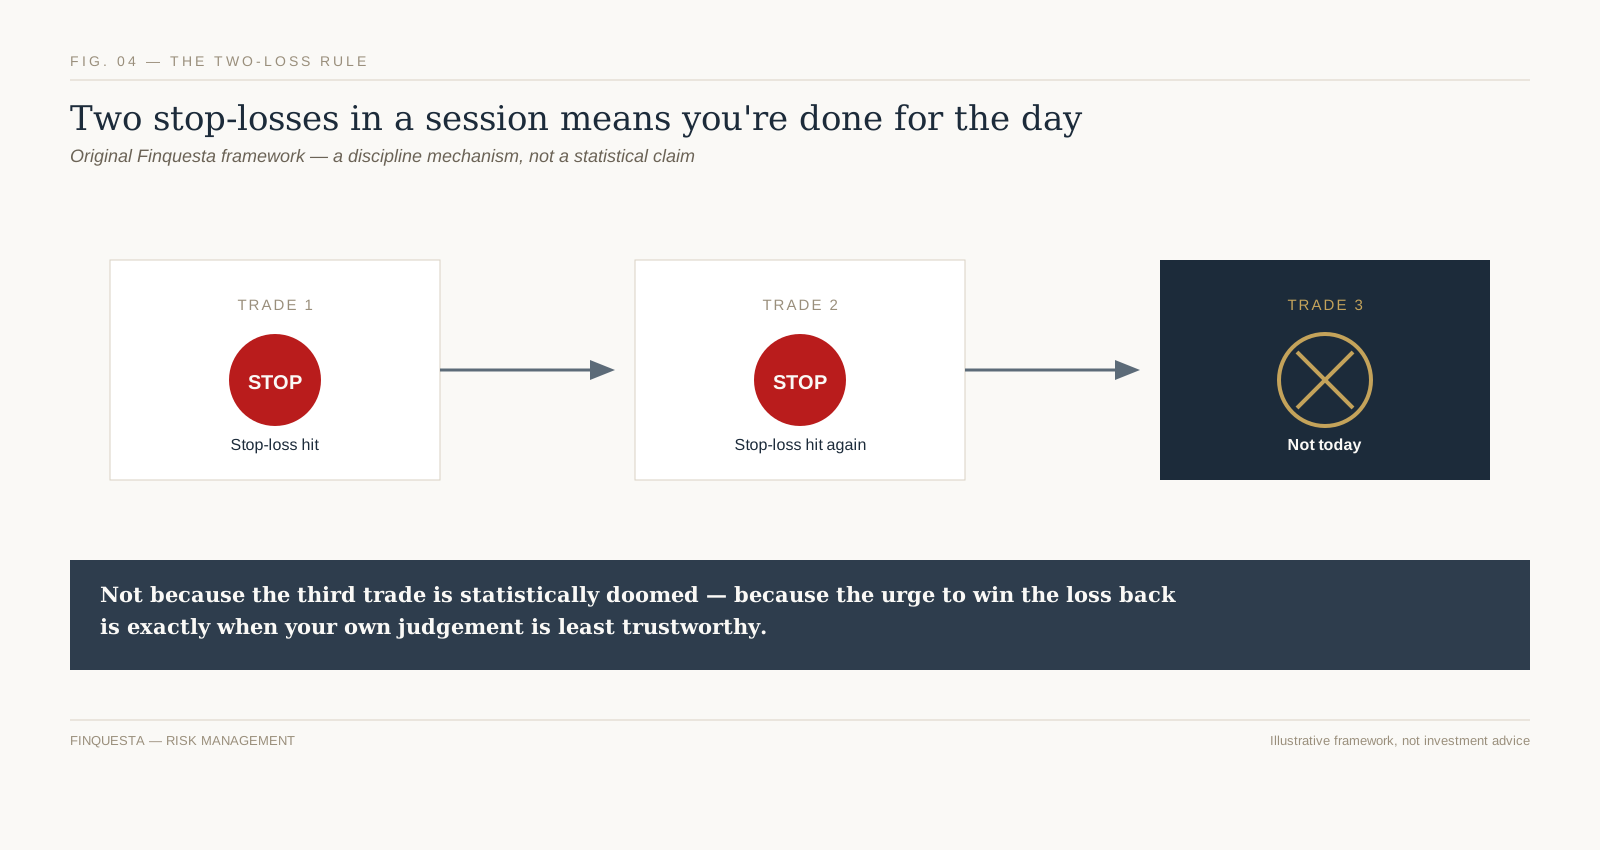
Fig. 04 — The Two-Loss Rule: after two consecutive stop-losses in one session, trading stops for the day
Common Beginner Mistakes That Empty Trading Accounts Fast
Trading with money you can’t afford to lose. Not a cliché — the single largest predictor of poor decision-making under pressure, because every trade becomes emotionally loaded when the outcome actually matters to your rent.
Averaging down without a plan. Buying more of a losing position “to lower the average price” can be a deliberate, pre-planned strategy for a long-term investment. For a trade that was supposed to have a stop-loss, it’s usually just a stop-loss you decided not to honour, dressed up as a strategy after the fact.
Overtrading. Placing trades out of boredom or the urge to be “doing something” during flat, directionless market stretches, rather than waiting for a setup that actually matches your plan.
Chasing a stock after a big move. Buying because a stock “already moved 8% today and might keep going” is buying based on the fact that you missed the move, not based on any actual signal that more is coming.
Ignoring position sizing on leveraged products. Treating an F&O lot the same way you’d size a delivery trade, without adjusting for the leverage embedded in the instrument, is how a manageable-looking mistake becomes an account-ending one.
Confusing a broker’s research call with your own analysis. Acting on a tip — from a broker, a friend, or a social media account — without being able to independently explain the trade is the fastest way to hold a position you don’t know how to manage when it moves against you.
Building a Simple First Watchlist and Trading Routine
A watchlist of 40 stocks is not a strategy, it’s noise — you can’t meaningfully track that many companies’ news, charts, and price action at once, and most beginners end up reacting to whichever of the 40 happens to be moving that day rather than trading with any plan. Five to eight stocks, in businesses you can actually explain and sectors you have some genuine familiarity with, is a far more workable starting list.
A simple routine beats an elaborate one you’ll abandon within a month: check your watchlist before market open for overnight news, note which levels (from your charts) matter for the day, place any planned orders with stop-losses attached at entry, and — critically — log the day’s trades that evening while the reasoning is still fresh, not three weeks later when you’re trying to reconstruct why you took a trade from memory. For more on building out a broader investing and market-literacy foundation alongside your trading practice, Finquesta’s guide to understanding the Indian stock market is a useful next stop.
It’s also worth periodically stepping back and revisiting Finquesta’s broader guide to investing in Indian stock markets — not because trading and investing are the same activity, but because understanding the investing side of the market makes you a better-informed trader, not a worse one. Every regulated venue you’ll trade on ultimately answers to SEBI’s investor protection framework, and every order you place is executed on an exchange — primarily the NSE or BSE — whose own published market data is worth getting comfortable reading directly rather than only through your broker’s app.
Frequently Asked Questions About Starting to Trade in India
Is stock trading legal and safe in India?
Yes — stock trading through a SEBI-registered broker on the NSE or BSE is fully legal, and your shares are held safely at an independent depository (NSDL or CDSL) regardless of what happens to your broker. “Safe” refers to the regulatory structure protecting your holdings, not to the trades themselves — trading capital can still be lost through normal market risk and poor decisions.
Can I start trading with ₹500 or ₹1,000?
Yes, for delivery-based equity trading, since Indian shares can be bought individually rather than in fixed lots. Whether that amount is enough to meaningfully practise the habits this guide covers is a separate question — very small amounts make losses too painless to teach real discipline, and gains too small to matter either.
What is the difference between trading and investing?
Trading aims to profit from short-term price movement over days to months, using charts and technical signals; investing aims to build wealth over years by owning a share of a growing business. The Time Horizon Test earlier in this guide is a quick way to work out which one you’re actually doing with any given position.
Do I need a demat account to trade, or just a trading account?
You need both for delivery-based trading — the demat account holds the shares you own, and the trading account executes the buy and sell orders. Most brokers open them together as a single “2-in-1” account. Pure intraday trading, where you never take delivery, still typically requires both to be opened as part of account setup, even though shares never actually settle into the demat account.
How much tax do I pay on trading profits in India?
It depends entirely on what kind of trade it was: delivery trades held over or under 12 months are taxed as long-term or short-term capital gains respectively, at rates set by the current Finance Act; intraday trades are taxed as speculative business income at your regular income-tax slab rate; and F&O trades are taxed as non-speculative business income, also at slab rate.
Can I lose more money than I invested in stock trading?
In plain delivery-based equity trading, no — the most you can lose is what you put in, since you own the shares outright. In leveraged segments like F&O, yes — certain option-selling and futures positions can generate losses larger than your initial margin, which is exactly why this guide treats F&O as a structurally different, higher-risk instrument rather than a natural next step from delivery trading.
Is intraday trading better than delivery trading for beginners?
No — delivery trading is the more forgiving starting point precisely because it has no same-day deadline forcing a decision, which gives a genuine beginner room to learn from a mistake instead of being forced to realise it by 3:30 PM. Intraday’s leverage and time pressure are usually a poor match for someone still building basic chart-reading and order-management skills.
How long does it take to learn how to read candlestick charts?
The core vocabulary — open, close, high, low, body, and wick, plus a handful of patterns like the ones covered in this guide — can genuinely be learned in an afternoon. Reading a chart well enough to trade on it with any consistency is a different, much longer skill, built through logged practice across many real trades, not through memorising pattern names.
What is the minimum capital needed for F&O trading in India?
This varies by contract, since F&O trades in exchange-defined lot sizes rather than individual units, and margin requirements are set per instrument and can change with volatility and SEBI’s evolving retail-suitability rules for the segment
Which is better for beginners: a full-service or a discount broker?
For someone trading their own capital in modest size, a discount broker’s flat, low per-order fee usually beats a full-service broker’s percentage-based brokerage on pure cost — and the “research and advisory” a full-service broker adds is something this guide would encourage you to be able to replicate yourself before you trade on anyone else’s call, including ours.
3 thoughts on “How to Start Trading in India: The Complete Beginner’s Friendly Guide (2026)”