
What is a mutual fund, and how does it actually work? This guide covers the mechanics, how to invest in India and the US, types of funds, NAV, SIP vs lump sum, XIRR, costs, tax, and 8 original concepts — written for any reader, from first-timer to retirement planner.
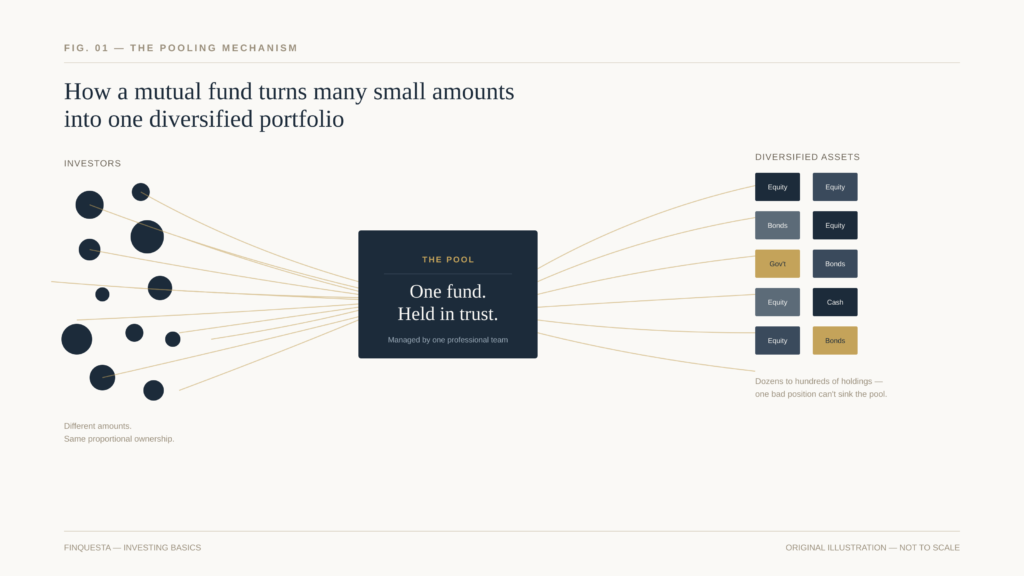
| What is a mutual fund — the answer in 90 words Think of a mutual fund as a shared investment account for thousands of strangers who never meet. Each contributor puts in their amount, a professional fund manager deploys the combined pool across dozens or hundreds of assets, and every investor’s return tracks the portfolio in proportion to what they put in. You own units. Units have a daily price called NAV. You can invest from Rs 500 per month via SIP in India, or from $1 via most major US platforms. Your money is regulated — SEBI in India, SEC in the US — but not guaranteed. Markets move, and so does your NAV. |
Table of Contents
How a mutual fund actually works — the plumbing most guides skip
Most people grasp the concept in five minutes. The mechanics beneath it take a bit longer — and they matter when things don’t behave as expected.
- Your instruction goes to the AMC: Your buy or sell order lands with the Asset Management Company — the SEBI-registered entity that manages the fund. The exact time your money clears matters more than the time you placed the order. This is covered in the NAV cut-off section below.
- Your money enters a ring-fenced trust: In India, mutual funds are constituted as trusts under the Indian Trusts Act, 1882. A trustee — not the AMC — holds your money in legal custody. SEBI (India) and the SEC (US) regulate every aspect of how the fund operates. The trust structure means your investment is legally separated from the AMC’s own finances. If the fund house closes tomorrow, the pooled assets belong to unit holders, not to the company’s creditors. That is a meaningful structural protection that most investors never think about until they need it.
- The manager or algorithm invests the pool: Active funds: a human fund manager and research team select specific securities, aiming to beat a benchmark. Passive funds: an algorithm mirrors an index — Nifty 50, Sensex, S&P 500 — mechanically, with no subjective judgment. No human can underperform relative to their own conviction when they have no conviction to express.
- NAV is computed after markets close: Every business day, the fund totals the current market value of all its holdings — a process called marking to market — subtracts liabilities, and divides by total units outstanding. AMFI publishes the figure by 11 PM. That number is the price at which your order for that day will be settled.
- Redemption settles in 1-3 business days: Submit a redemption request, units cancel at that day’s NAV (cut-off rules apply — see below), money reaches your bank account within 1 business day for liquid funds and 2-3 days for most equity and debt funds.
Why the trust structure matters more than most people realise: The Franklin Templeton India 2020 episode — when six debt schemes were wound up due to liquidity stress — is instructive. Investors eventually got their money back because the underlying bond assets belonged to them inside the trust, not to Franklin Templeton as a corporate entity. The winding-up process was painful and slow, but the legal protection held. That would not have been the case with an unregulated investment scheme.
Key terms — decoded without jargon
Every term you will encounter, explained in one clear clause:
| Term | What it means | Why it matters to you |
| NAV | Per-unit price of the fund. Published daily after markets close. | This is what you pay to buy and receive when you sell. Not a stock price — it doesn’t move intraday. |
| Units | Your ownership stake in the pool. Like shares in a company, but in a fund. | Invest Rs 5,000 at NAV Rs 50 = 100 units. NAV rises to Rs 70 = your units are worth Rs 7,000. |
| AUM | Total money managed by the fund across all investors. | India’s total mutual fund industry AUM exceeded Rs 73 lakh crore in early 2026. |
| Expense Ratio / TER | Annual management fee, expressed as % of AUM, deducted daily from NAV before publication. | Invisible but real. 1% on Rs 10 lakh = Rs 10,000 per year quietly leaving your account without a bill. |
| SIP | Systematic Investment Plan — a fixed amount invested automatically every month. | India-specific term. Equivalent to the US ‘automatic investment plan’. Removes the question of when to invest. |
| Lump Sum | A single large investment, not split across months. | Higher entry-point risk. If markets drop right after, the impact is greater than it would be with a staggered SIP. |
| Direct Plan | Bought directly from the AMC — no distributor commission. | Lower expense ratio than Regular plan for the identical underlying portfolio. Always the lower-cost choice. |
| Regular Plan | Same portfolio, bought via a distributor who earns a commission from the fund. | The AMC pays the commission by raising the expense ratio. You pay more for the same exposure. |
| IDCW | Income Distribution cum Capital Withdrawal — SEBI renamed this from ‘Dividend’ in April 2021. | When the fund pays an IDCW, your NAV drops by exactly that amount. It is not extra income. |
| Growth Plan | Gains are reinvested. NAV compounds over time with no payouts. | Better for long-term wealth building. Full compounding, no tax events until you redeem. |
| Exit Load | A fee charged when you redeem before a specified holding period. | Usually 1% if redeemed within 12 months. Check the Scheme Information Document before investing. |
| Tracking Difference | Actual annual return gap between the index fund and its benchmark index. | More honest than expense ratio alone. A fund with 0.15% TER but 0.45% tracking difference costs you 0.45% annually. |
| KIM | Key Information Memorandum — 2-page SEBI-mandated factsheet every fund must publish. | Covers objective, risk, costs, and fund manager. Takes 5 minutes to read. Worth reading before every investment. |
The three formulas that actually matter
NAV calculation
Computed daily, published by 11 PM on AMFI:
| NAV = (Total Market Value of Assets − Liabilities) ÷ Units Outstanding |
Example: Fund holds stocks worth Rs 10 crore. Liabilities (accrued fees, pending redemptions): Rs 10 lakh. Units outstanding: 9 lakh.
NAV = (Rs 10,00,00,000 − Rs 10,00,000) ÷ 9,00,000 = Rs 110 per unit
You invest Rs 11,000. You get 100 units at Rs 110. A year later, NAV = Rs 135. Your 100 units = Rs 13,500. Return: 22.7%.
Lump sum compounding
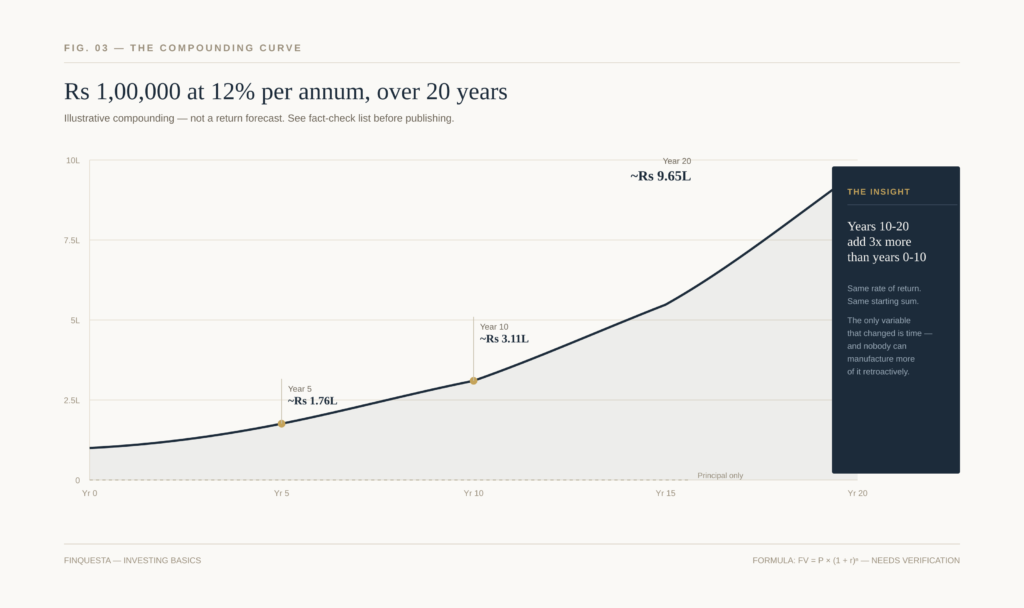
| Future Value = P × (1 + r)ⁿ |
P = amount invested · r = annual return rate · n = years
| Illustrative lump sum example Rs 1,00,000 invested at a hypothetical steady 12% per annum: Year 5: Rs 1,00,000 × (1.12)^5 = approx. Rs 1,76,234 Year 10: Rs 1,00,000 × (1.12)^10 = approx. Rs 3,10,585 Year 20: Rs 1,00,000 × (1.12)^20 = approx. Rs 9,64,629 The jump from year 10 to year 20 more than triples the value again — on the same original rupee. Not because the rate changed, but because the exponent compounded on a larger base. Time is the variable nobody can buy more of after the fact. |
SIP future value
| FV = P × [((1 + r)ⁿ − 1) ÷ r] × (1 + r) |
P = monthly SIP · r = monthly return (annual ÷ 12) · n = total months
| Illustrative SIP example Rs 5,000 per month for 15 years at 12% per annum (hypothetical): r = 12%/12 = 1% = 0.01, n = 180 months FV = 5,000 × [((1.01)^180 − 1) ÷ 0.01] × 1.01 ≈ Rs 25.2 lakh Total invested: Rs 9 lakh | Growth from returns: ≈ Rs 16.2 lakh |
XIRR vs CAGR — the return number that most platforms don’t explain
This is the single most practically useful thing missing from most Indian beginner guides. The return percentage shown on your investment app is either CAGR or XIRR. They are not the same number, and using the wrong one for the wrong type of investment gives you a fundamentally misleading picture of your actual performance.
| CAGR | XIRR | |
| Full name | Compound Annual Growth Rate | Extended Internal Rate of Return |
| Right for | Single lump sum, held without additions or withdrawals | SIPs, multiple investments, irregular redemptions |
| What it models | One starting amount, one ending value, straight compounding | Every individual cash flow with its exact date and rupee amount |
| Why it fails for SIPs | Each monthly SIP instalment was held for a different length of time. CAGR ignores this completely. | Accounts for timing of every cash flow — gives the true annualised return of the entire SIP history |
| How to calculate | (End Value ÷ Start Value)^(1/n) − 1 | No simple formula. Use Excel XIRR() function or your investment platform |
| What to demand from your app | For lump sum: CAGR is correct | For SIP: insist on XIRR. ‘Absolute return’ (e.g. ‘87% total gain’) is not comparable across different durations |
The test: Open your platform and find your SIP return. If it shows a % without saying CAGR or XIRR, call the helpline and ask which method is being used. If they say ‘absolute return’, that number cannot be meaningfully compared to anything — not the index, not a friend’s portfolio, not a fixed deposit rate.
The NAV cut-off clock — which day’s price you actually get
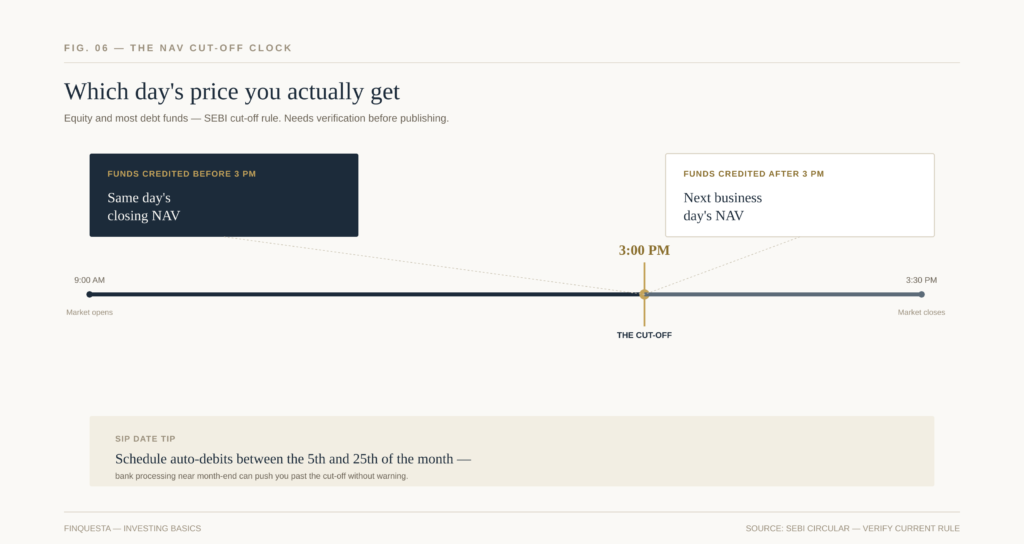
Almost never covered in beginner guides, even though it directly affects the price of every transaction you make. You do not automatically get the NAV of the day you clicked ‘Invest’.
| How the NAV cut-off works — India (SEBI rules) The applicable NAV depends on WHEN your money is credited to the AMC’s account — not when you tapped ‘Buy’. For equity and most debt funds (excluding liquid and overnight): Funds credited to AMC before 3:00 PM on a business day = that day’s closing NAV Funds credited after 3:00 PM = next business day’s NAV A real scenario: You place a buy order at 2:50 PM Monday. Your bank processes the debit at 3:08 PM. You receive Tuesday’s NAV. If NAV rose on Monday night, you pay more than you expected. SIP date tip: Bank transfers often process slowly on the 1st, 31st, or dates adjacent to public holidays. Set your SIP date between the 5th and 25th of the month to avoid cut-off timing misses. |
Types of mutual funds — matched to goals and time horizons
The right fund is never ‘the best fund in India right now’. It is the fund whose risk profile matches your goal’s time horizon. Here is how to think about it:
| Fund type | What it holds | Time horizon | Who it suits |
| Large-Cap Equity | Top 100 companies by market cap — SEBI mandates minimum 80% allocation here | 5+ years | First-time equity investors who want growth with relatively lower intra-category volatility |
| Mid-Cap Equity | Companies ranked 101-250 by market cap | 7+ years | Investors comfortable with 30-40% short-term swings in exchange for higher long-term growth potential |
| Small-Cap Equity | Companies ranked 251+ by market cap | 10+ years | Satellite allocation only — high potential, but drawdowns can be severe and recovery can take years |
| Flexi-Cap / Multi-Cap | Fund manager moves freely across all market cap sizes | 5-7+ years | Investors who want a skilled manager to navigate market cycles without category restrictions |
| Index Funds (Passive) | Mirrors an index — Nifty 50, Nifty Next 50, S&P 500 — mechanically, at very low cost | Any long-term goal | Beginners, cost-conscious investors, anyone who wants set-and-forget market exposure |
| ELSS | Equity fund + Section 80C tax deduction — 3-year mandatory lock-in | 3+ years minimum | Tax-saving under old regime AND long-term equity exposure in one instrument |
| Hybrid / Balanced Advantage | Auto-rebalances between equity and debt based on market valuation signals | 3-5+ years | Moderate-risk investors who want market participation but with a built-in dampening mechanism |
| Short-Duration Debt | Corporate bonds and government securities under 3-year maturity | 1-3 years | Goals too near for equity to recover from a potential drawdown in time |
| Liquid / Overnight | Ultra-short money market instruments — near-zero risk | 0-6 months | Emergency fund parking — not for growth, but for instant availability at a better yield than savings accounts |
| Gold / International | Gold ETFs or overseas indices — satellite diversifiers | 5+ years | 5-15% of a portfolio for diversification across asset classes or geographies, not as a standalone strategy |
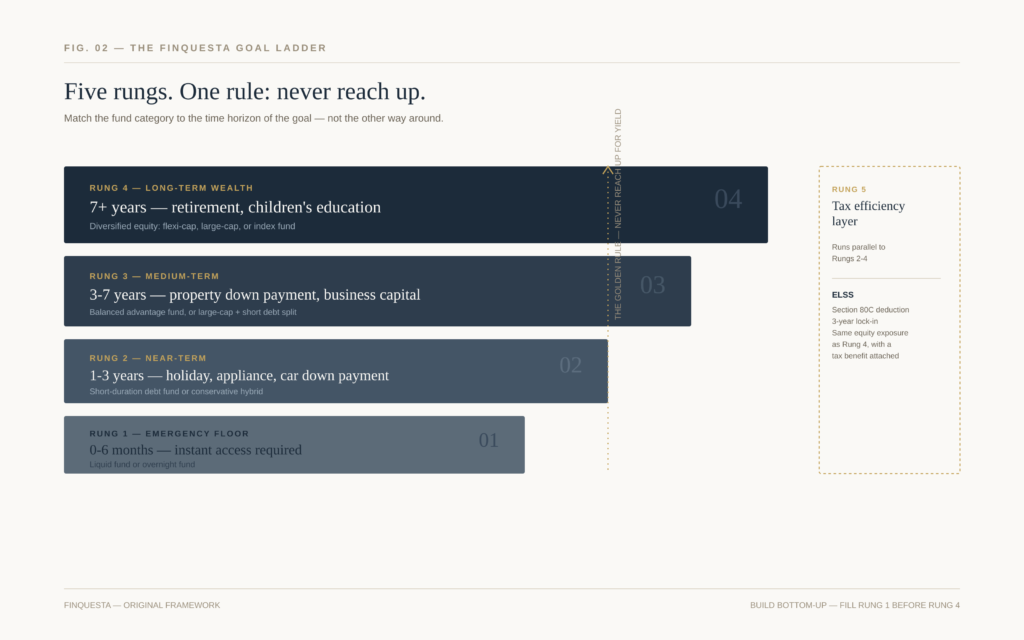
The Goal Ladder — a Finquesta framework for matching funds to your life
Original framework. ‘Match funds to your goals’ is advice given everywhere. This framework shows exactly how — with a rule that most guides miss entirely.
| The Finquesta Goal Ladder — five rungs, one rule Picture your financial life as a ladder. Each rung represents a category of goal, ordered by time horizon. The governing rule: a lower rung MUST NEVER reach up for a higher return. The emergency fund does not get invested in small-cap equity because ‘returns are better’. Safety is the point of the lower rungs. Return is the point of the upper rungs. Never mix them up. RUNG 1 — Emergency floor (0-6 months of expenses, accessible in 24-48 hours): Vehicle: Liquid fund or overnight fund The goal here is not to grow — it is to be there. RUNG 2 — Near-term goals (1-3 years: holiday, appliance, vehicle down payment): Vehicle: Short-duration debt fund or conservative hybrid A 30% equity market drop takes 2-3 years to recover. Your 2-year goal cannot wait. RUNG 3 — Medium-term goals (3-7 years: property down payment, further education abroad): Vehicle: Balanced advantage fund, or large-cap equity + short-duration debt in a ratio Some equity is appropriate — but not 100%, because the recovery window may not be long enough. RUNG 4 — Long-term wealth goals (7+ years: retirement, children’s college fund): Vehicle: Diversified equity — flexi-cap, large-cap, or Nifty 50 index fund in Direct plan This is where equity works properly, across full market cycles. RUNG 5 — Tax efficiency layer (parallel to Rungs 2-4, India old tax regime only): Vehicle: ELSS for the Section 80C portion of long-term equity allocation Same equity exposure, with a tax deduction attached. The 3-year lock-in forces patience. Build the Goal Ladder bottom-up. Fill Rung 1 before touching Rung 4. This order matters more than which specific fund you pick at each rung. |
Active funds vs index funds — what the evidence says, and where it’s uncertain
This is the most-studied question in professional investing. Here is what the data shows, where the debate is genuinely unresolved, and what beginners should take from it.
| Active funds | Index funds (passive) | |
| Manager | Human fund manager + research team | Index rules — no human judgment, no manager risk |
| Goal | Outperform the benchmark | Match the benchmark |
| Typical Direct plan TER (India) | 0.5%–1.5% for large-cap active | 0.05%–0.20% for Nifty 50 trackers |
| What data shows | SPIVA India: over 80% of active large-cap funds underperformed Nifty 100 TRI across 10-year periods. | By structural design, matches the index minus the fee. Cannot underperform its own mandate. |
| Where active may genuinely win | Mid and small-cap India — less efficiently priced, giving skilled managers real scope to add value | Large-cap India and most developed markets — too efficiently priced for most managers to consistently add value after costs |
| The critical benchmark issue | Many active funds appear to ‘beat the Nifty 50’ — but the correct benchmark is the Nifty 50 Total Return Index (TRI), which includes dividends reinvested. Measured against TRI, the bar is meaningfully higher and fewer funds clear it. | Tracking difference is the honest cost measure for passive funds — it’s the actual annual gap between the fund’s return and the index return, not just the expense ratio |
| Our view | Neither wins universally. Cost is the only variable you can guarantee before investing. Everything else — manager skill, market efficiency, macro timing — is uncertain. | For most beginners, a low-cost Nifty 50 index fund in Direct plan is a well-evidenced starting point. |
Costs — the invisible drag that compounds against you
Mutual fund fees are deducted from NAV before it is published. There is no bill. No notification. Over two decades, even a 1% annual fee gap produces a difference of lakhs on the same underlying investment.
| Fee impact — what 1.4% per year actually costs over 20 years Same market, same Rs 1,00,000 invested, two different cost structures: Fund A — Direct plan index fund, 0.10% expense ratio → net return ≈ 9.90% p.a. Fund B — Regular plan active fund, 1.50% expense ratio → net return ≈ 8.50% p.a. Fund A ending value after 20 years: approximately Rs 6,49,000 Fund B ending value after 20 years: approximately Rs 4,92,000 Gap: approximately Rs 1,57,000 — paid entirely in fees to Fund B for exposure to the same underlying market. What this means: Fund B’s manager needs to outperform Fund A’s gross portfolio by 1.4% per year, every year, for 20 consecutive years — just to break even with you net of costs. That is a very high bar to hold, consistently, across bull markets, bear markets, and every cycle in between. |
Four cost items to check before every investment:
- Expense Ratio (TER): Always look at the Direct plan TER, not the Regular plan. Available on AMFI (amfiindia.com) or the fund factsheet. For equity index funds today: under 0.20% is achievable. For active large-cap: under 1% in Direct plan is reasonable.
- Tracking Difference (index funds): More honest than TER alone. It is the actual annual gap between fund return and index return. A fund with 0.15% TER but 0.45% tracking difference costs you 0.45% per year, not 0.15%.
- Exit Load: Usually 1% if redeemed within 12 months. Read the Scheme Information Document (SID). Not all funds charge an exit load, and some use tiered structures.
- Tax on gains: Not a fund fee, but as real a cost as TER. Covered in the tax section below.
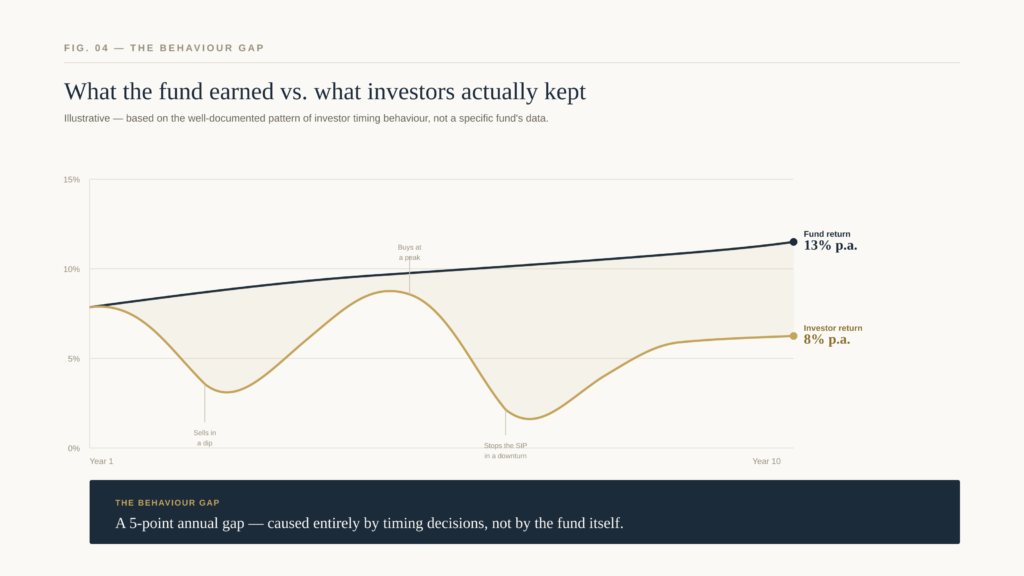
The Behaviour Gap — why your returns will likely be lower than the fund’s returns
This is probably the most important concept in this entire article — and it appears in almost no Indian beginner guide.
| The Behaviour Gap — defined with an uncomfortable illustration A mutual fund delivers 13% per year over 10 years, measured from the first NAV to the last. The average investor in that same fund earns 8% per year across the same decade. How a 5% gap opens between the fund’s number and the investor’s number: — Markets rise 40% across 18 months. Retail money floods in at the top. — Markets fall 30% in a correction. Retail money withdraws at the bottom. — SIPs stop in March 2020 when NAVs are at their cheapest. — They restart in January 2021 when NAVs have already recovered. Every one of those decisions was made for understandable reasons. Every one of them subtracted from the investor’s actual return. The 5% gap is not caused by the fund. It is caused by the investor’s own response to price signals. This is the Behaviour Gap — the difference between what an investment earns and what you earn from it. The implication is not comfortable: the most important investing decision is not which fund to pick. It is whether you will leave the SIP running when every headline tells you to stop it. |
Why point-to-point returns deceive you — and what rolling returns reveal
Every ranking site shows ‘5-year returns from today’. That number describes one specific 5-year window in history. It does not tell you what the fund did in other 5-year windows — which is where the useful information lives.
The point-to-point problem: Fund A returned 22% over 5 years from January 2021 to January 2026. But January 2021 happened to be a market low and January 2026 a market high. Any fund would look good from that starting point. The number measures timing luck as much as manager skill.
| Rolling returns — how they remove the timing bias A 3-year rolling return calculated over 7 years slides a 3-year measurement window across every possible start month: Window 1: Jan 2019 – Jan 2022 → one 3-year return Window 2: Feb 2019 – Feb 2022 → another 3-year return Window 3: Mar 2019 – Mar 2022 → another … 48+ windows total Now you can ask the right questions: Average 3-year return across all windows? = consistency across market conditions Worst 3-year return? = downside risk — the number that matters for planning % of windows where it beat its benchmark? = skill measured repeatedly, not once. A fund with 12% average rolling 3-year return and +2% as its worst case is far more dependable for a real investor than a fund with 16% average but -9% worst case. Where to find rolling return data: PrimeInvestor.in and ValueResearchOnline. Neither is affiliated with Finquesta — they are genuinely the best tools for this analysis. |
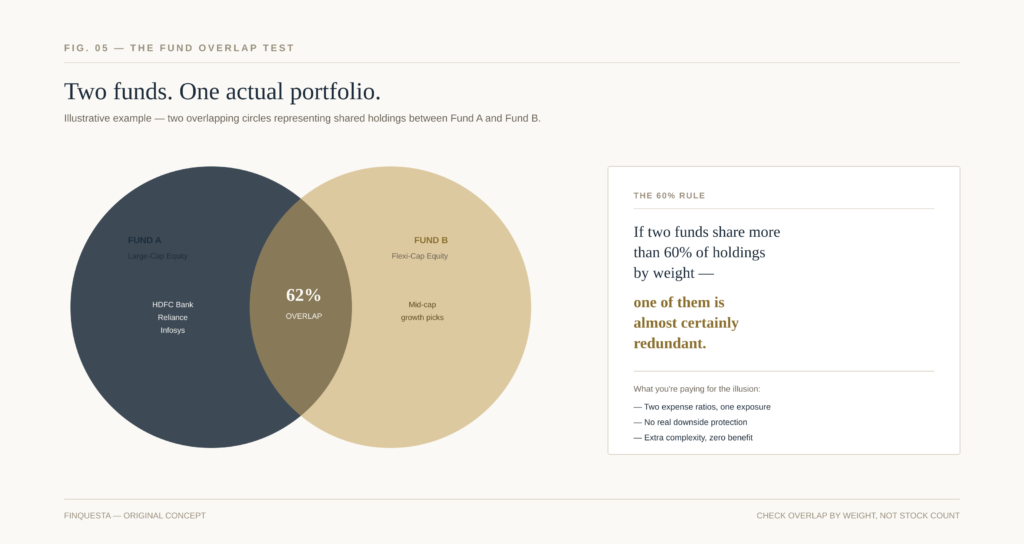
The Fund Overlap test — real diversification vs the illusion of it
Investors who have been investing for 3-5 years often carry 8-12 mutual funds. They feel diversified. In most cases, they are not.
| What fund overlap is, and what it costs you Fund overlap is the percentage of your combined portfolio sitting in identical stocks across multiple funds. An example that plays out in thousands of Indian portfolios: Fund A (large-cap): 30% of portfolio in HDFC Bank, Reliance, Infosys Fund B (flexi-cap): 26% of portfolio in the same three stocks Apparent holding: two funds | Actual exposure: one concentrated portfolio, counted twice What you pay for this illusion: Two expense ratios for one portfolio’s worth of exposure Extra administrative complexity with no diversification benefit When the large-cap sector corrects, both funds fall together — as if you had one fund. The 60% rule: if two funds share more than 60% of their holdings by weight, one of them is almost certainly redundant. How to check: PrimeInvestor.in Fund Overlap Tool (free). Compare by weight, not just by counting common names. A shared stock at 0.3% weight barely matters. A shared stock at 9% weight matters a great deal. The Finquesta guideline: three non-overlapping funds — one large-cap or index, one mid/small or flexi, one debt or hybrid — provide all the diversification an individual investor genuinely needs. More funds add complexity, not protection. |
How to start investing — practical steps
India
- Complete KYC first: Mandatory before any mutual fund investment. PAN + Aadhaar. Most platforms offer eKYC completion in under 10 minutes. If you opened a bank account or demat account recently, check whether you are already verified.
- Choose Direct plan via Direct channel: Go directly to the AMC website (HDFC MF, Mirae Asset, SBI MF, etc.) or use platforms that offer Direct plans — Groww, Zerodha Coin, Kuvera, MF Central (mfcentral.com). Avoid Regular plan unless you genuinely need an adviser’s ongoing service and the cost is worth it to you.
- Apply the Goal Ladder: Before choosing a fund, identify which rung of your life it belongs to (see framework above). That determines the fund category. Specific fund selection comes after category selection.
- Set up SIP with auto-debit: Schedule between the 5th and 25th of the month to avoid NAV cut-off timing issues. Let it run automatically. The discipline of automation is worth more than the decision about which date to choose.
- Review annually, not after every NAV movement: Check whether your allocation still matches your Goal Ladder once per year, or after a major life change. Do not act on quarterly performance data.
United States
- Open a brokerage account (Vanguard, Fidelity, Schwab). Use tax-advantaged accounts first — 401(k) via employer for pre-tax contributions, Roth IRA for potential tax-free growth, Traditional IRA as an alternative.
- ETFs vs mutual funds: for the same index exposure, ETFs often win in a taxable US account because they do not distribute capital gains annually — a structural tax drag that mutual funds create even for investors who did not sell. Vanguard’s comparable ETF and mutual fund typically carry identical expense ratios, so the tax difference is the deciding factor.
- Target-date funds: one-decision option. Buy the fund matching your retirement year (e.g. 2050 fund) and it shifts automatically from equity-heavy toward debt-heavy as you approach the date. Higher expense ratio than a pure index ETF but lower behavioural risk for investors who prefer to set something and never reconsider it.
Global note
UK: OEICs / unit trusts held in ISAs (tax-free) or SIPPs (pension). Europe: UCITS funds inside pension or investment wrappers. Singapore: unit trusts via CPF or standard cash accounts. Australia: superannuation is the primary vehicle — employer contributions invested in pooled structures by default. The underlying mechanics are identical across all these structures; the tax wrapper, regulator, and contribution rules differ. Verify locally before acting.
The ‘100 minus age’ rule — useful as a starting point, dangerous as a final answer
It is in almost every personal finance article. Almost none of them explain the assumptions it was built on — or why those assumptions no longer hold.
| What the rule says Your equity allocation (%) = 100 minus your age. At 30: 70% equity + 30% debt. At 60: 40% equity + 60% debt. Adjust down by reducing equity as you age. |
The rule was built for a world with shorter retirement periods and reliably high fixed-income rates. Three specific things have changed:
- Longer lives mean longer retirement periods: A 60-year-old in urban India today has a reasonable probability of living to 83-87. That is potentially 25+ years of post-retirement expenses. Allocating 60% to debt at age 60 may protect against short-term volatility but risks running out of purchasing power long before running out of life — particularly with India’s historical 6-8% consumer inflation. The 100-minus-age formula does not account for longevity risk at all.
- The base number is wrong for many people: Many financial advisers now use 110 minus age or 120 minus age for investors with good health, any guaranteed income source (pension, rental income, EPF), or no dependents. The exact number should come from your specific income floor and expected expenses in retirement, not a universal shortcut.
- Debt is not equivalent to ‘safe’: Interest rate risk in long-duration debt funds, credit risk in corporate bond funds, and the Franklin Templeton India 2020 liquidity event remind investors that ‘debt = safe’ is a simplification. A conservative investor who shifts into long-duration debt because it feels safe can lose 8-10% in a rising rate environment. Safe means matched to your time horizon, not just labelled as non-equity.
How to use the rule: Treat it as a first approximation only. Then adjust based on three factors: how many years you expect to spend in retirement, whether you have guaranteed income sources to cover basic expenses, and your genuine ability — not theoretical — to hold a 30% portfolio drop without selling. Someone with a pension covering basic expenses can afford more equity at 65 than someone relying entirely on their accumulated corpus.
Tax on mutual fund gains — India and US overview
| Jurisdiction note Tax rules differ completely between countries and change frequently. The India figures below are sourced from 2026 search research but all items marked must be confirmed on incometax.gov.in or the relevant Finance Act before publishing. |
India — equity funds
- STCG (held under 12 months): Taxed at 20% on gains.
- LTCG (held over 12 months): Gains above Rs 1.25 lakh per year taxed at 12.5%, without indexation.
- ELSS: Qualifies for Section 80C deduction up to Rs 1.5 lakh per year (old tax regime only). Gains on maturity subject to LTCG rules above.
India — debt funds (significant recent change)
- From April 2023: Gains from debt mutual funds are taxed at the investor’s income tax slab rate, for all holding periods. The long-term indexation benefit that previously made debt funds attractive for higher-income investors was removed. This changes the post-tax return calculation significantly for debt fund investors relative to bank FDs.
United States
- Taxable account: Short-term gains (under 1 year) = ordinary income tax rates. Long-term gains (over 1 year) = preferential rates.
- Tax-advantaged accounts: Traditional 401(k)/IRA: tax-deferred growth. Roth IRA: potentially tax-free qualified withdrawals.
- Capital gain distributions: US mutual funds are required to distribute realised capital gains annually, creating a taxable event even if you did not sell any units. ETFs structurally avoid this through in-kind creation/redemption. For US investors with taxable accounts, this is a concrete advantage of ETFs over equivalent mutual funds.
The Inertia Trap — why understanding a mutual fund is not the same as investing in one
Original Finquesta concept. This is the explanation for the most puzzling pattern in personal finance: people who know what mutual funds are, know SIPs exist, know Direct plans are better — and still have not invested.
| The Inertia Trap — three self-reinforcing causes The Inertia Trap is the gap between comprehending a financial product and actually using it. It has three causes that feed each other: 1. Choice paralysis: India has over 2,500 mutual fund schemes across 44 AMCs. Which one is best for me?’ is a question with no clean answer — and when there is no clean answer, the human brain defaults to doing nothing. The rational response to uncertainty becomes the enemy of starting. … 2. Perfectionism delay: ‘I will start investing once I have properly understood everything.’Properly understanding everything takes six months minimum. By which point markets have moved, your research feels outdated, and you restart. This loop runs indefinitely for some people. 3. Market-timing fear: ‘I will wait until the market corrects before starting my SIP.’ This is the most ironic cause. Waiting for a correction to start a SIP defeats the purpose of a SIP — which was specifically designed to make the question of market timing irrelevant. The cure is a deliberately undersized first step: one fund, one SIP, Rs 500 per month, today. You can adjust, add, or change everything later. The decision that matters is starting. A Rs 500 SIP that starts today compounds forward. A Rs 10,000 SIP that starts three years from now does not — because those three years are gone. The Inertia Trap is most severe among intelligent, well-informed people, because they have the highest threshold for certainty before acting. Investing offers certainty about costs. It offers nothing else in advance. |
Common myths — what is actually true
| Myth | What is actually true |
| A fund with NAV Rs 10 is cheaper / better value than one at Rs 500 | NAV is a historical price, not a valuation. Buying 1 unit of a Rs 500 NAV fund vs 50 units of a Rs 10 NAV fund gives you identical purchasing power if both funds hold equivalent portfolios. What matters is how NAV grows — not its absolute level today. |
| A SIP removes market risk | A SIP does not remove market risk — it restructures your exposure to timing risk. Instead of one large bet on one market day, you spread smaller bets across months. Your average entry cost typically improves during market falls. But if the market falls and stays down across your entire investment horizon, a SIP will not protect you from loss. |
| Owning 10 funds is better diversification than 3 funds | Not if those 10 funds hold 70% of the same stocks. Fund overlap is the relevant test, not fund count. Three funds with genuinely distinct mandates and low portfolio overlap serve most investors better than ten funds that are effectively the same portfolio filed under different names. |
| The fund that topped last year’s chart is a good choice for this year | Selecting funds by recent rank is pattern-matching on noise. A fund leading for 12 months is almost always benefiting from a sector tailwind that will eventually reverse. Historical equity fund returns reflect the specific economic conditions of those years, not a promise about the years ahead. |
| Stopping your SIP during a market crash is the prudent response | From a wealth-building perspective, it is the opposite. A market drop means the same Rs 5,000 SIP buys more units at lower prices — the mechanism that makes SIP cost-effective. Stopping during a crash converts a temporary paper loss into a permanent decision to buy high only. Investors who paused SIPs in March 2020 and restarted later missed the accumulation window that benefited those who continued. |
| Direct plan and Regular plan give similar results over time | They do not. The same fund in Direct plan has a lower expense ratio than its Regular plan counterpart — the difference equals the distributor commission. Compounded over 15-20 years, this gap accumulates into a material difference in corpus, for the same underlying portfolio and the same underlying market performance. |
| Mutual funds are only for long-term stock investing | The risk spectrum in mutual funds runs from near-zero (overnight funds) to very high (small-cap equity). Debt funds, liquid funds, and conservative hybrids serve investors who need capital stability over short or medium horizons. |
| Mutual fund vs FD: one is always better | Different instruments for different purposes. An FD provides a guaranteed, pre-agreed return with DICGC insurance up to Rs 5 lakh per bank per depositor. A mutual fund provides market-linked returns with no guarantee. For a 12-month goal: FD or liquid fund. For a 20-year retirement goal: equity mutual funds have historically delivered superior real returns — but historical returns describe the past, not the future. |
Frequently asked questions
What is a mutual fund in simple terms?
A mutual fund is a regulated, pooled investment account. Thousands of investors each contribute money. A professional manager invests the combined amount across a diversified set of assets. You own units — a proportional share of the pool. Returns and losses flow through to all unit holders in proportion to what they hold.
Is investing in a mutual fund safe?
Two different questions are often asked as one. Structurally safe: yes — mutual funds in India are constituted as trusts, regulated by SEBI, and require mandatory daily disclosure. Your money is legally separated from the AMC. Market safe: no — equity mutual funds can and do lose value in the short term. A liquid fund carries near-zero risk; a small-cap equity fund can fall 40% in a market downturn. ‘Safe’ always means safe relative to your time horizon.
Can I lose money in a mutual fund?
Yes, particularly in the short term in equity funds. An investor who bought an equity fund in February 2020 and sold in April 2020 would have lost approximately 25-30% of their capital in that window. Historical data shows Indian equity markets have recovered and grown over sufficiently long periods — but the word ‘sufficiently’ matters. For a 3-year goal, an equity fund is not appropriate. For a 15-year goal, the historical evidence of recovery is strong.
What is SIP and why is it different from just investing monthly?
SIP is not just a payment schedule — it is a structural approach to eliminating timing decisions. By investing a fixed amount regardless of whether NAV is rising or falling, you automatically buy more units when prices are low and fewer when prices are high. This is called rupee cost averaging. The result over time is an average cost per unit that is typically lower than the simple average of all the NAVs across that period. SIP does not guarantee a profit, but it removes the need to predict market direction before investing.
What is the difference between a mutual fund and an FD?
A fixed deposit gives you a contractually guaranteed return. The bank specifies the rate before you invest, and it does not change. An FD is insured by DICGC up to Rs 5 lakh per bank per depositor. A mutual fund gives you market-linked returns. There is no pre-agreed number. For money you need within 1-2 years or cannot afford to see fall in value, an FD or liquid fund is the appropriate choice. For money you can commit for 7+ years and want to grow meaningfully above inflation, an equity mutual fund has historically served investors better — without guaranteeing it will continue to do so.
What is XIRR and why should I know about it?
XIRR is the accurate measure of your SIP’s annualised return. Because each monthly SIP was invested at a different NAV and has been held for a different length of time, a simple percentage return figure does not account for this complexity. XIRR does — it calculates the internal rate of return across all your dated cash flows. If your investment app shows ‘absolute return’ (e.g. ‘87% total gain’) for a SIP, that number cannot be compared to a fund’s published CAGR, to an FD rate, or to any benchmark. Always ask for XIRR when evaluating SIP performance.
How many mutual funds should I own?
Fewer than most people think. Three to five funds with genuinely different mandates and low portfolio overlap cover all the diversification an individual investor needs. One for large-cap or index exposure, one for mid/small-cap if your time horizon allows, one for short-term or defensive allocation. Adding more funds without running a portfolio overlap check typically increases complexity without increasing diversification — and sometimes reduces it.
SIP vs lump sum — which is better?
For a salaried investor with monthly income: SIP, almost always. It removes timing decisions and builds disciplined investing into a routine. For a windfall (bonus, inheritance, asset sale): you can invest it all at once if you have a long horizon and the market is not at an obvious extreme valuation. Alternatively, park the amount in a liquid fund and transfer a fixed amount monthly into your equity fund over 6-12 months — this is called a Systematic Transfer Plan (STP) and is the most structured way to deploy a lump sum without large single-day timing risk.
| Disclaimer This article is for informational and educational purposes only and does not constitute financial, investment, tax, or legal advice. Figures, rates, and regulations mentioned are subject to change; please verify current details with official sources (RBI, SEBI, the Income Tax Department, IRS, or a licensed financial advisor) before making financial decisions. Finquesta may earn a commission from affiliate links in this article at no extra cost to you. |
4 thoughts on “What Is a Mutual Fund? What Most Beginners Get Wrong (2026)”